Timeline of the 2020 Pacific hurricane season
| Timeline of the 2020 Pacific hurricane season | |||||||
|---|---|---|---|---|---|---|---|
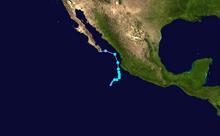
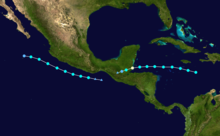
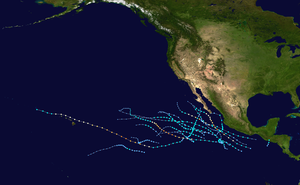 Season summary map | |||||||
| Season boundaries | |||||||
| First system formed | April 25, 2020 | ||||||
| Last system dissipated | November 19, 2020 | ||||||
| Strongest system | |||||||
| Name | Marie | ||||||
| Maximum winds | 140 mph (220 km/h) (1-minute sustained) | ||||||
| Lowest pressure | 945 mbar (hPa; 27.91 inHg) | ||||||
| Longest lasting system | |||||||
| Name | Douglas | ||||||
| Duration | 8 days | ||||||
| |||||||
| Other years 2018, 2019, 2020, 2021, 2022 | |||||||
The 2020 Pacific hurricane season was an event in the annual cycle of tropical cyclone formation, in which tropical cyclones form in the Eastern Pacific Ocean. The season officially started on May 15 in the Eastern Pacific—east of 140°W—and began on June 1 in the Central Pacific—the region between the International Date Line and 140°W–and ended on November 30. These dates typically cover the period of each year when most tropical cyclones form in the Eastern Pacific basin according to the National Hurricane Center.[nb 1][1] However, tropical cyclones sometimes form outside the bounds of an official season, as was evidenced by the formation of Tropical Depression One-E on April 25. The season effectively ended with the dissipation of its final storm, Tropical Storm Polo, on November 19.
The formation of One-E on April 25 marked the earliest start to a Pacific hurricane season on record. However, seasonal activity as a whole was generally below average. The season featured 16 named storms, in line with the 1981–2010 long-term average of 15. It featured just four hurricanes, or half the average. Three of those hurricanes intensified into major hurricanes,[nb 2] which compares to the average of four. A few storms produced substantial impact to land in 2020. In May, Tropical Storm Amanda caused widespread damage and killed numerous people in El Salvador, Guatemala, and Honduras.[3] In August, the remnants of Tropical Storm Fausto sparked devastating wildfires across Northern California,[4] while Genevieve produced hurricane-force winds and caused additional fatalities in the Baja California peninsula.[5] Lesser but still deadly effects were produced there by Tropical Storm Hernan as well.[6] A month prior, Hurricane Douglas passed very close to Oahu, though it caused only minor impact.[7]
This timeline documents tropical cyclone formations, strengthening, weakening, landfalls, extratropical transitions, and dissipations during the season. It includes information that was not released throughout the season, meaning that data from post-storm reviews by the National Hurricane Center, such as a storm that was not initially warned upon, has been included.
By convention, meteorologists use one time zone when issuing forecasts and making observations: Coordinated Universal Time (UTC), and also use the 24-hour clock (where 00:00 = midnight UTC).[8] Tropical cyclone advisories in the Eastern North Pacific basin use both UTC and the nautical time zone where the center of the tropical cyclone is currently located. Time zones utilized (east to west) are: Central, Mountain, Pacific and Hawaii. In this timeline, all information is listed by UTC first, with the respective regional time zone included in parentheses. Additionally, figures for maximum sustained winds and position estimates are rounded to the nearest 5 units (knots, miles, or kilometers), following National Hurricane Center practice. Direct wind observations are rounded to the nearest whole number. Atmospheric pressures are listed to the nearest millibar and nearest hundredth of an inch of mercury.
Timeline

April

April 25
- 06:00 UTC (11:00 p.m. PDT April 24) at 13°30′N 115°30′W / 13.5°N 115.5°W / 13.5; -115.5 (Tropical Depression One-E develops.) – Tropical Depression One-E forms from a low-pressure area about 805 mi (1,295 km) southwest of the southern tip of the Baja California peninsula, becoming the earliest tropical cyclone on record in the East Pacific. It simultaneously attains peak winds of 35 mph (55 km/h) and a minimum barometric pressure of 1,006 mb (29.71 inHg).[9]
April 26
- 12:00 UTC (5:00 a.m. PDT) at 15°30′N 118°30′W / 15.5°N 118.5°W / 15.5; -118.5 (Tropical Depression One-E becomes a remnant low.) – Tropical Depression One-E degenerates into a remnant low about 920 mi (1,480 km) southwest of the southern tip of the Baja California peninsula.[9]
May

May 15
- The 2022 Pacific hurricane season officially begins in the East Pacific.[1]
May 30
- 18:00 UTC (1:00 p.m. CDT) at 12°12′N 90°54′W / 12.2°N 90.9°W / 12.2; -90.9 (Tropical Depression Two-E forms.) – Tropical Depression Two-E forms from the complex interaction of a Kelvin wave, a cold-core low, and a tropical wave about 115 mi (185 km) south of Puerto San José, Guatemala.[3]
May 31
- 06:00 UTC (1:00 a.m. CDT) at 13°18′N 90°24′W / 13.3°N 90.4°W / 13.3; -90.4 (Two-E becomes Amanda.) – Tropical Depression Two-E strengthens into Tropical Storm Amanda about 35 mi (55 km) south-southwest of the Guatemala–El Salvador border. It reaches peak winds of 40 mph (65 km/h) and a minimum barometric pressure of 1,003 mb (29.62 inHg).[3]
- 10:00 UTC (5:00 a.m. CDT) at 13°48′N 90°18′W / 13.8°N 90.3°W / 13.8; -90.3 (Amanda makes landfall.) – Tropical Storm Amanda makes landfall near Las Lisas, Guatemala, with winds of 40 mph (65 km/h).[3]
- 18:00 UTC (1:00 p.m. CDT) at 16°00′N 90°00′W / 16.0°N 90.0°W / 16.0; -90.0 (Amanda dissipates.) – Tropical Storm Amanda dissipates about 100 mi (165 km) north-northeast of Guatemala City, Guatemala. Its remnants lead to the formation of Tropical Storm Cristobal in the Gulf of Mexico.[nb 3][3]
June

June 1
- The season in the Central Pacific officially begins.[1]
June 24
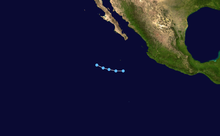
- 06:00 UTC (8:00 p.m. HST, June 23) at 10°00′N 131°54′W / 10.0°N 131.9°W / 10.0; -131.9 (Tropical Depression Three-E forms.) – Tropical Depression Three-E forms from the complex interaction of a tropical wave, an area of disturbed weather, and the favorable phase of the Madden–Julian oscillation about 1,710 mi (2,750 km) southwest of the southern tip of the Baja California peninsula.[10]
June 25
- 18:00 UTC (8:00 a.m. HST) at 11°00′N 136°48′W / 11.0°N 136.8°W / 11.0; -136.8 (Tropical Depression Three-E becomes Boris.) – Tropical Depression Three-E strengthens into Tropical Storm Boris about 1,330 mi (2,145 km) east-southeast of Hilo, Hawaii. It attains peak winds of 40 mph (65 km/h) and a minimum barometric pressure of 1,005 mb (29.68 inHg).[10]
June 26
- 06:00 UTC (8:00 p.m. HST, June 25) at 11°36′N 138°06′W / 11.6°N 138.1°W / 11.6; -138.1 (Boris weakens to a depression.) – Tropical Storm Boris weakens into a tropical depression about 1,235 mi (1,990 km) east-southeast of Hilo, Hawaii.[10]

June 28
- 00:00 UTC (2:00 p.m. HST, June 27) at 12°12′N 141°42′W / 12.2°N 141.7°W / 12.2; -141.7 (Boris becomes a remnant low.) – Tropical Depression Boris degenerates to a remnant low about 1,015 mi (1,635 km) east-southeast of Hilo, Hawaii.[10]
June 29
- 18:00 UTC (12:00 p.m. MDT) at 20°30′N 112°36′W / 20.5°N 112.6°W / 20.5; -112.6 (Tropical Depression Four-E forms.) – Tropical Depression Four-E forms from the interaction of an area of disturbed weather and a tropical wave about 255 mi (410 km) southwest of the southern tip of the Baja California peninsula. It attains peak winds of 30 mph (45 km/h) and a minimum barometric pressure of 1,006 mb (29.71 inHg).[11]
June 30
- 18:00 UTC (12:00 p.m. MDT) at 20°30′N 112°36′W / 20.5°N 112.6°W / 20.5; -112.6 (Tropical Depression Four-E forms.) – Tropical Depression Four-E degenerates to a remnant low about 235 mi (380 km) southwest of the southern tip of the Baja California peninsula.[11]
July

July 6
- 18:00 UTC (1:00 p.m. CDT) at 10°24′N 99°30′W / 10.4°N 99.5°W / 10.4; -99.5 (Tropical Depression Five-E forms.) – Tropical Depression Five-E forms from a tropical wave about 435 mi (700 km) south of Acapulco, Mexico.[12]
July 7
- 06:00 UTC (1:00 a.m. CDT) at 11°24′N 101°30′W / 11.4°N 101.5°W / 11.4; -101.5 (Tropical Depression Five-E intensifies into Tropical Storm Cristina.) – Tropical Depression Five-E intensifies into Tropical Storm Cristina about 390 mi (630 km) south-southwest of Acapulco, Mexico.[12]
July 10
- 18:00 UTC (1:00 p.m. MDT) at 19°24′N 114°48′W / 19.4°N 114.8°W / 19.4; -114.8 (Tropical Storm Cristina attains its peak intensity.) – Tropical Storm Cristina attains peak winds of 70 mph (110 km/h) and a minimum barometric pressure of 993 mb (29.32 inHg) about 390 mi (630 km) southwest of the southern tip of the Baja California peninsula.[12]
July 12
- 18:00 UTC (11:00 a.m. PDT) at 20°36′N 124°48′W / 20.6°N 124.8°W / 20.6; -124.8 (Tropical Storm Cristina degenerates to a remnant low.) – Tropical Storm Cristina degenerates to a remnant low about 965 mi (1,555 km) west-southwest of the southern tip of the Baja California peninsula.[12]
July 13
- 12:00 UTC (6:00 a.m. MDT) at 16°36′N 110°24′W / 16.6°N 110.4°W / 16.6; -110.4 (Tropical Depression Six-E forms.) – Tropical Depression Six-E forms from a tropical wave about 470 mi (755 km) south-southwest of Cabo San Lucas, Mexico. It attains peak winds of 35 mph (55 km/h) and a minimum barometric pressure of 1,007 mb (29.74 inHg).[13]
July 14
- 18:00 UTC (11:00 a.m. PDT) – Tropical Depression Six-E dissipates about 610 mi (980 km) west-southwest of the southern tip of the Baja California peninsula.[13]

July 20
- 00:00 UTC (5:00 p.m. PDT, July 19) at 17°00′N 128°00′W / 17.0°N 128°W / 17.0; -128 (Tropical Depression Seven-E forms.) – Tropical Depression Seven-E forms from a tropical wave about 1,235 mi (1,990 km) west-southwest of the southern tip of the Baja California peninsula.[14]
- 00:00 UTC (5:00 p.m. PDT, July 19) at 14°42′N 118°48′W / 14.7°N 118.8°W / 14.7; -118.8 (Tropical Depression Eight-E forms.) – Tropical Depression Eight-E forms from a tropical wave about 805 mi (1,295 km) southwest of the southern tip of the Baja California peninsula.[15]
- 12:00 UTC at 18°18′N 129°42′W / 18.3°N 129.7°W / 18.3; -129.7 (Tropical Depression Seven-E intensifies into an unnamed tropical storm.) – Tropical Depression Seven-E intensifies into an unnamed tropical storm about 1,315 mi (2,115 km) west-southwest of the southern tip of the Baja California peninsula. It attains peak winds of 40 mph (65 km/h) and a minimum barometric pressure of 1,006 mb (29.71 inHg).[nb 4][14]
- 18:00 UTC (11:00 a.m. PDT) at 13°30′N 120°00′W / 13.5°N 120.0°W / 13.5; -120.0 (Tropical Depression Eight-E becomes Tropical Storm Douglas.) – Tropical Depression Eight-E intensifies into Tropical Storm Douglas about 920 mi (1,480 km) south of the southern tip of the Baja California peninsula.[15]
July 22
- 18:00 UTC (11:00 a.m. PDT) at 11°54′N 130°18′W / 11.9°N 130.3°W / 11.9; -130.3 (Tropical Storm Douglas becomes a hurricane.) – Tropical Storm Douglas intensifies into a Category 1 hurricane about midway between the coastline of southwestern Mexico and Hawaii.[15]
July 23
- 06:00 UTC (11:00 p.m. PDT, July 22) at 12°48′N 133°18′W / 12.8°N 133.3°W / 12.8; -133.3 (Hurricane Douglas rapidly intensifies into a Category 3 hurricane.) – Hurricane Douglas rapidly intensifies into a Category 3 hurricane about 1,680 mi (2,705 km) southwest of the southern tip of the Baja California Peninsula.[15]

July 24
- 00:00 UTC (5:00 p.m. PDT, July 23) at 14°36′N 138°00′W / 14.6°N 138.0°W / 14.6; -138.0 (Hurricane Douglas intensifies into a Category 4 hurricane.) – Hurricane Douglas intensifies into a Category 4 hurricane about 1,915 mi (3,080 km) west-southwest of the southern tip of the Baja California peninsula. It simultaneously attains peak winds of 130 mph (215 km/h) and a minimum barometric pressure of 954 mb (28.17 inHg).[15]
- 12:00 UTC (2:00 a.m. HST) at 16°06′N 141°06′W / 16.1°N 141.1°W / 16.1; -141.1 (Hurricane Douglas weakens to a Category 3 hurricane.) – Hurricane Douglas weakens to a Category 3 hurricane about 950 mi (1,530 km) southeast of Hilo, Hawaii, as it crosses into the Central Pacific Hurricane Center area of responsibility.[15]
July 25
- 06:00 UTC (8:00 p.m. HST, July 24) at 18°12′N 145°54′W / 18.2°N 145.9°W / 18.2; -145.9 (Hurricane Douglas weakens to a Category 2 hurricane.) – Hurricane Douglas weakens to a Category 2 hurricane about 610 mi (980 km) southeast of Hilo, Hawaii.[15]
July 26
- 00:00 UTC (2:00 p.m. HST, July 25) at 19°42′N 150°42′W / 19.7°N 150.7°W / 19.7; -150.7 (Hurricane Douglas weakens to a Category 1 hurricane.) – Hurricane Douglas weakens to a Category 1 hurricane about 285 mi (460 km) east of Hilo, Hawaii.[15]
July 28
- 00:00 UTC (2:00 p.m. HST, July 27) at 22°54′N 162°48′W / 22.9°N 162.8°W / 22.9; -162.8 (Hurricane Douglas weakens to a tropical storm.) – Hurricane Douglas weakens to a tropical storm about 545 mi (875 km) northwest of Hilo, Hawaii.[15]
July 29
- 12:00 UTC (2:00 a.m. HST) at 24°36′N 174°24′W / 24.6°N 174.4°W / 24.6; -174.4 (Tropical Storm Douglas degenerates to a remnant low.) – Tropical Storm Douglas degenerates to a remnant low about 1,285 mi (2,070 km) northwest of Hilo, Hawaii.[15]
August
August 8
- 18:00 UTC (1:00 p.m. CDT) at 14°06′N 101°00′W / 14.1°N 101.0°W / 14.1; -101.0 (Tropical Depression Nine-E forms.) – Tropical Depression Nine-E forms from a tropical wave about 175 mi (280 km) south-southwest of Lazaro Cardenas, Mexico.[16]
August 9
- 06:00 UTC (1:00 a.m. CDT) at 15°36′N 103°24′W / 15.6°N 103.4°W / 15.6; -103.4 (Tropical Depression Nine-E becomes Tropical Storm Elida) – Tropical Depression Nine-E intensifies into Tropical Storm Elida about 230 mi (370 km) south-southeast of Manzanillo, Mexico.[16]
August 10
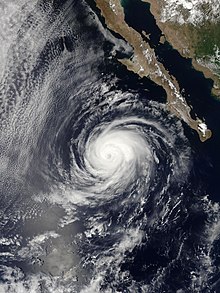
- 18:00 UTC (12:00 p.m. MDT) at 19°12′N 110°18′W / 19.2°N 110.3°W / 19.2; -110.3 (Tropical Storm Elida intensifies into a hurricane.) – Tropical Storm Elida intensifies into a Category 1 hurricane about 255 mi (410 km) south of the southern tip of the Baja California peninsula.[16]
August 11
- 12:00 UTC (6:00 a.m. MDT) at 21°06′N 113°30′W / 21.1°N 113.5°W / 21.1; -113.5 (Hurricane Elida becomes a Category 2 hurricane and reaches peak intensity.) – Hurricane Elida intensifies into a Category 2 hurricane about 255 mi (410 km) southwest of the southern tip of the Baja California peninsula. It simultaneously attains peak winds of 105 mph (165 km/h) and a minimum barometric pressure of 971 mb (28.67 inHg).[16]
August 12
- 00:00 UTC (5:00 p.m. PDT, August 11) at 22°12′N 116°00′W / 22.2°N 116.0°W / 22.2; -116.0 (Hurricane Elida weakens to a Category 1 hurricane.) – Hurricane Elida weakens to a Category 1 hurricane about 390 mi (630 km) west-southwest of the southern tip of the Baja California peninsula.[16]
- 12:00 UTC (5:00 a.m. PDT) at 23°06′N 118°18′W / 23.1°N 118.3°W / 23.1; -118.3 (Hurricane Elida weakens to a tropical storm.) – Hurricane Elida weakens to a tropical storm about 530 mi (855 km) west of the southern tip of the Baja California peninsula.[16]
August 13
- 00:00 UTC (5:00 p.m. PDT, August 12) at 24°06′N 120°00′W / 24.1°N 120.0°W / 24.1; -120.0 (Tropical Storm Elida degenerates to a remnant low.) – Tropical Storm Elida degenerates to a remnant low about 405 mi (650 km) southwest of the central portion of the Baja California peninsula coastline.[16]
- 06:00 UTC (11:00 p.m. PDT, August 12) at 13°30′N 128°48′W / 13.5°N 128.8°W / 13.5; -128.8 (Tropical Depression Ten-E forms.) – Tropical Depression Ten-E forms from a disturbance in the monsoon trough about 1,610 mi (2,590 km) west-southwest of the southern tip of the Baja California peninsula. It simultaneously attains peak winds of 35 mph (55 km/h) and a minimum barometric pressure of 1,004 mb (29.65 inHg).[17]

August 16
- 00:00 UTC (5:00 p.m. PDT, August 15) at 18°00′N 118°12′W / 18.0°N 118.2°W / 18.0; -118.2 (Tropical Depression Eleven-E forms.) – Tropical Depression Eleven-E forms from a tropical wave about 635 mi (1,020 km) west-southwest of the southern tip of the Baja California peninsula.[18]
- 12:00 UTC (5:00 a.m. PDT) at 13°36′N 133°54′W / 13.6°N 133.9°W / 13.6; -133.9 (Tropical Depression Ten-E degenerates to a remnant low.) – Tropical Depression Ten-E degenerates to a remnant low about 1,695 mi (2,730 km) southwest of the southern tip of the Baja California peninsula.[17]
- 12:00 UTC (5:00 a.m. PDT) at 20°24′N 119°18′W / 20.4°N 119.3°W / 20.4; -119.3 (Tropical Depression Eleven-E becomes Tropical Storm Fausto.) – Tropical Depression Eleven-E intensifies into Tropical Storm Fausto about 625 mi (1,005 km) southwest of the southern tip of the Baja California peninsula. It attains peak winds of 40 mph (65 km/h) and a minimum barometric pressure of 1,004 mb (29.65 inHg).[18]
- 18:00 UTC (11:00 a.m. PDT) at 21°42′N 120°30′W / 21.7°N 120.5°W / 21.7; -120.5 (Tropical Storm Fausto weakens to a tropical depression.) – Tropical Storm Fausto weakens to a tropical depression about 680 mi (1,095 km) west-southwest of the southern tip of the Baja California peninsula.[18]
- 12:00 UTC (7:00 a.m. CDT) at 11°18′N 96°30′W / 11.3°N 96.5°W / 11.3; -96.5 (Tropical Depression Twelve-E forms.) – Tropical Depression Twelve-E forms from a tropical wave about 300 mi (485 km) south of Puerto Ángel, Mexico.[5]
- 18:00 UTC (1:00 p.m. CDT) at 11°48′N 98°00′W / 11.8°N 98.0°W / 11.8; -98.0 (Tropical Depression Twelve-E intensifies into Tropical Storm Genevieve.) – Tropical Depression Twelve-E intensifies into Tropical Storm Genevieve about 365 mi (585 km) southeast of Acapulco, Mexico.[5]

August 17
- 12:00 UTC (5:00 a.m. PDT) at 23°18′N 125°18′W / 23.3°N 125.3°W / 23.3; -125.3 (Tropical Storm Fausto degenerates to a remnant low.) – Tropical Depression Fausto degenerates to a remnant low about 980 mi (1,575 km) west of the southern tip of the Baja California peninsula.[18]
- 12:00 UTC (7:00 a.m. CDT) at 13°54′N 102°18′W / 13.9°N 102.3°W / 13.9; -102.3 – Tropical Storm Genevieve intensifies into a Category 1 hurricane about 290 mi (465 km) south of Lazaro Cardenas, Mexico.[5]
August 18
- 00:00 UTC (6:00 p.m. MDT, August 17) at 16°00′N 105°18′W / 16.0°N 105.3°W / 16.0; -105.3 (Hurricane Genevieve intensifies into a Category 2 hurricane.) – Hurricane Genevieve intensifies into a Category 2 hurricane about 370 mi (595 km) west-southwest of Acapulco, Mexico.[5]
- 12:00 UTC (6:00 a.m. MDT) at 17°42′N 107°36′W / 17.7°N 107.6°W / 17.7; -107.6 (Hurricane Genevieve intensifies into a Category 4 hurricane.) – Hurricane Genevieve rapidly intensifies into a Category 4 hurricane, skipping Category 3 status, about 225 mi (360 km) west-southwest of Manzanillo, Mexico. It simultaneously attains peak winds of 130 mph (215 km/h) and a minimum barometric pressure of 950 mb (28.05 inHg).[5]
- 18:00 UTC (12:00 p.m. MDT) at 18°18′N 108°18′W / 18.3°N 108.3°W / 18.3; -108.3 (Hurricane Genevieve weakens to a Category 3 hurricane.) – Hurricane Genevieve weakens to a Category 3 hurricane about 330 mi (530 km) south-southeast of the southern tip of the Baja California peninsula.[5]
August 19
- 06:00 UTC (12:00 a.m. MDT) at 19°54′N 109°12′W / 19.9°N 109.2°W / 19.9; -109.2 (Hurricane Genevieve weakens to a Category 2 hurricane.) – Hurricane Genevieve weakens to a Category 2 hurricane about 210 mi (340 km) south of the southern tip of the Baja California peninsula.[5]
- 18:00 UTC (12:00 p.m. MDT) at 21°06′N 109°54′W / 21.1°N 109.9°W / 21.1; -109.9 (Hurricane Genevieve weakens to a Category 1 hurricane.) – Hurricane Genevieve weakens to a Category 1 hurricane about 120 mi (195 km) south of the southern tip of the Baja California peninsula.[5]
August 20
- 18:00 UTC (12:00 p.m. MDT) at 23°24′N 112°00′W / 23.4°N 112.0°W / 23.4; -112.0 (Hurricane Genevieve weakens to a tropical storm.) – Hurricane Genevieve weakens to a tropical storm about 140 mi (225 km) west-northwest of the southern tip of the Baja California peninsula.[5]
August 21
- 18:00 UTC (11:00 a.m. PDT) at 25°24′N 115°12′W / 25.4°N 115.2°W / 25.4; -115.2 (Tropical Storm Genevieve degenerates to a remnant low.) – Tropical Storm Genevieve degenerates to a remnant low about 375 mi (605 km) west-northwest of the southern tip of the Baja California peninsula.[5]
August 26
- 06:00 UTC (12:00 a.m. MDT) at 17°12′N 106°48′W / 17.2°N 106.8°W / 17.2; -106.8 (Tropical Storm Hernan forms.) – Tropical Storm Hernan forms from a disturbance in the monsoon trough about 340 mi (545 km) south-southwest of Cabo Corrientes, Mexico.[6]
- 12:00 UTC (5:00 a.m. PDT) at 15°18′N 117°06′W / 15.3°N 117.1°W / 15.3; -117.1 (Tropical Depression Fourteen-E forms.) – Tropical Depression Fourteen-E forms from a tropical wave about 690 mi (1,110 km) southwest of the southern tip of the Baja California peninsula.[19]
- 18:00 UTC (2:00 p.m. PDT) at 15°30′N 116°48′W / 15.5°N 116.8°W / 15.5; -116.8 (Tropical Depression Fourteen-E intensifies into Tropical Storm Iselle.) – Tropical Depression Fourteen-E intensifies into Tropical Storm Iselle about 680 mi (1,095 km) south-southwest of the southern tip of the Baja California peninsula.[19]
August 27
- 06:00 UTC (12:00 a.m. MDT) at 18°24′N 105°48′W / 18.4°N 105.8°W / 18.4; -105.8 (Tropical Storm Hernan attains peak intensity.) – Tropical Storm Hernan attains peak winds of 45 mph (75 km/h) and a minimum barometric pressure of 1,001 mb (29.56 inHg) about 110 mi (175 km) southwest of Manzanillo, Mexico.[6]

August 28
- 06:00 UTC (11:00 p.m. PDT, August 27) at 17°42′N 115°36′W / 17.7°N 115.6°W / 17.7; -115.6 (Tropical Storm Iselle attains peak intensity.) – Tropical Storm Iselle attains peak winds of 50 mph (85 km/h) and a minimum barometric pressure of 997 mb (29.44 inHg) about 510 mi (820 km) southwest of the southern tip of the Baja California peninsula.[19]
- 12:00 UTC (6:00 a.m. MDT) at 23°06′N 108°36′W / 23.1°N 108.6°W / 23.1; -108.6 (Tropical Storm Hernan weakens to a tropical depression.) – Tropical Storm Hernan weakens to a tropical depression about 90 mi (145 km) east of the southern tip of the Baja California peninsula.[6]
- 18:00 UTC (12:00 p.m. MDT) at 23°00′N 109°36′W / 23.0°N 109.6°W / 23.0; -109.6 (Tropical Depression Hernan degenerates to a remnant low.) – Tropical Depression Hernan degenerates to a remnant low just offshore the southern tip of the Baja California peninsula.[6]
August 30
- 06:00 UTC (12:00 a.m. MDT) at 22°06′N 113°48′W / 22.1°N 113.8°W / 22.1; -113.8 (Tropical Storm Iselle weakens to a tropical depression.) – Tropical Storm Iselle weakens to a tropical depression about 250 mi (400 km) west-southwest of the southern tip of the Baja California peninsula.[19]
- 18:00 UTC (12:00 p.m. MDT) at 23°24′N 113°18′W / 23.4°N 113.3°W / 23.4; -113.3 (Tropical Depression Iselle degenerates to a remnant low.) – Tropical Depression Iselle degenerates to a remnant low about 215 mi (345 km) west-northwest of the southern tip of the Baja California peninsula.[19]
September
September 5
- 00:00 UTC (7:00 p.m. CDT, September 4) at 14°48′N 97°24′W / 14.8°N 97.4°W / 14.8; -97.4 (Tropical Storm Julio forms.) – Tropical Storm Julio forms from the remnants of the Atlantic's Hurricane Nana about 85 mi (135 km) southwest of Puerto Ángel, Mexico.[20]
September 6
- 00:00 UTC (7:00 p.m. CDT, September 5) at 16°48′N 103°54′W / 16.8°N 103.9°W / 16.8; -103.9 (Tropical Storm Julio attains peak intensity.) – Tropical Storm Julio attains peak winds of 45 mph (75 km/h) and a minimum barometric pressure of 1,004 mb (29.65 inHg) about 155 mi (250 km) south-southeast of Manzanillo, Mexico.[20]
September 7
- 00:00 UTC (6:00 p.m. MDT, September 6) at 19°18′N 110°42′W / 19.3°N 110.7°W / 19.3; -110.7 (Tropical Storm Julio weakens to a tropical depression.) – Tropical Storm Julio weakens to a tropical depression about 40 mi (65 km) north-northeast of Socorro Island.[20]
- 06:00 UTC (12:00 a.m. MDT) – Tropical Depression Julio dissipates.[20]
September 12
- 18:00 UTC (12:00 p.m. MDT) at 15°48′N 112°00′W / 15.8°N 112.0°W / 15.8; -112.0 (Tropical Depression Sixteen-E forms.) – Tropical Depression Sixteen-E forms from a tropical wave about 540 mi (870 km) south-southwest of the southern tip of the Baja California peninsula.[21]

September 13
- 06:00 UTC (12:00 a.m. MDT) at 17°00′N 113°24′W / 17.0°N 113.4°W / 17.0; -113.4 (Tropical Depression Sixteen-E intensifies into Tropical Storm Karina.) – Tropical Depression Sixteen-E intensifies into Tropical Storm Karina about 460 mi (740 km) southwest of the southern tip of the Baja California peninsula.[21]
September 15
- 00:00 UTC (5:00 p.m. PDT, September 14) at 18°42′N 119°18′W / 18.7°N 119.3°W / 18.7; -119.3 (Tropical Storm Karina attains peak intensity.) – Tropical Storm Karina attains peak winds of 60 mph (95 km/h) and a minimum barometric pressure of 996 mb (29.41 inHg) about 690 mi (1,110 km) west-southwest of the southern tip of the Baja California peninsula.[21]
September 16
- 18:00 UTC (11:00 a.m. PDT) at 22°48′N 124°06′W / 22.8°N 124.1°W / 22.8; -124.1 (Tropical Storm Karina degenerates to a remnant low.) – Tropical Storm Karina degenerates to a remnant low about 920 mi (1,480 km) west of the southern tip of the Baja California peninsula.[21]
September 20
- 18:00 UTC (12:00 p.m. MDT) at 15°42′N 108°00′W / 15.7°N 108.0°W / 15.7; -108.0 (Tropical Depression Seventeen-E forms.) – Tropical Depression Seventeen-E forms from a trough that originates on the southern side of the Atlantic's Tropical Storm Beta. It organizes into a tropical depression about 575 mi (925 km) south-southeast of the southern tip of the Baja California peninsula.[22]
September 21
- 18:00 UTC (12:00 p.m. MDT) at 17°12′N 112°48′W / 17.2°N 112.8°W / 17.2; -112.8 (Tropical Depression Seventeen-E becomes Tropical Storm Lowell.) – Tropical Depression Seventeen-E intensifies into Tropical Storm Lowell about 460 mi (740 km) south-southwest of the southern tip of the Baja California peninsula.[22]
September 23
- 06:00 UTC (11:00 p.m. PDT, September 22) at 19°36′N 119°18′W / 19.6°N 119.3°W / 19.6; -119.3 (Tropical Storm Lowell attains peak intensity.) – Tropical Storm Lowell attains peak winds of 50 mph (85 km/h) and a minimum barometric pressure of 1,001 mb (29.56 inHg) about 805 mi (1,295 km) south-southwest of the southern tip of the Baja California peninsula.[22]
September 25
- 18:00 UTC (11:00 a.m. PDT) at 21°30′N 129°48′W / 21.5°N 129.8°W / 21.5; -129.8 (Tropical Storm Lowell degenerates to a remnant low.) – Tropical Storm Lowell degenerates to a remnant low about 1,265 mi (2,035 km) west of the southern tip of the Baja California peninsula.[22]
September 29
- 06:00 UTC (12:00 a.m. MDT) at 13°30′N 107°00′W / 13.5°N 107.0°W / 13.5; -107.0 (Tropical Depression Eighteen-E forms.) – Tropical Depression Eighteen-E forms from a disturbance within the monsoon trough about 415 mi (670 km) southwest of Manzanillo, Mexico.[23]
- 18:00 UTC (12:00 p.m. MDT) at 13°36′N 109°00′W / 13.6°N 109.0°W / 13.6; -109.0 (Tropical Depression Eighteen-E becomes Tropical Storm Marie.) – Tropical Depression Eighteen-E intensifies into Tropical Storm Marie about 490 mi (790 km) south-southwest of Manzanillo, Mexico.[23]
October
October 1
- 00:00 UTC (5:00 p.m. PDT, September 30) at 14°24′N 116°06′W / 14.4°N 116.1°W / 14.4; -116.1 (Tropical Storm Marie intensifies into a hurricane.) – Tropical Storm Marie intensifies into a Category 1 hurricane about 710 mi (1,145 km) south-southwest of the southern tip of the Baja California peninsula.[23]
- 12:00 UTC (5:00 a.m. PDT) at 14°48′N 119°00′W / 14.8°N 119.0°W / 14.8; -119.0 (Hurricane Marie intensifies into a Category 2 hurricane.) – Hurricane Marie intensifies into a Category 2 hurricane about 810 mi (1,305 km) southwest of the southern tip of the Baja California peninsula.[23]

October 2
- 00:00 UTC (5:00 p.m. PDT, October 1) at 15°24′N 121°30′W / 15.4°N 121.5°W / 15.4; -121.5 (Hurricane Marie intensifies into a Category 3 hurricane.) – Hurricane Marie intensifies into a Category 3 hurricane about 910 mi (1,465 km) southwest of the southern tip of the Baja California peninsula.[23]
- 06:00 UTC (11:00 p.m. PDT, October 1) at 15°54′N 122°36′W / 15.9°N 122.6°W / 15.9; -122.6 (Hurricane Marie intensifies into a Category 4 hurricane.) – Hurricane Marie intensifies into a Category 4 hurricane about 955 mi (1,535 km) southwest of the southern tip of the Baja California peninsula. It attains peak winds of 140 mph (220 km/h) and a minimum barometric pressure of 945 mb (27.91 inHg).[23]
October 3
- 12:00 UTC (5:00 a.m. PDT) at 18°06′N 126°42′W / 18.1°N 126.7°W / 18.1; -126.7 (Hurricane Marie weakens to a Category 3 hurricane.) – Hurricane Marie weakens to a Category 3 hurricane about 1,130 mi (1,820 km) west-southwest of the southern tip of the Baja California peninsula.[23]
October 4
- 06:00 UTC (11:00 p.m. PDT, October 3) at 19°30′N 128°00′W / 19.5°N 128.0°W / 19.5; -128.0 (Hurricane Marie weakens to a Category 2 hurricane.) – Hurricane Marie weakens to a Category 2 hurricane about 1,180 mi (1,900 km) west-southwest of the southern tip of the Baja California peninsula.[23]
- 12:00 UTC (5:00 a.m. PDT) at 19°48′N 128°30′W / 19.8°N 128.5°W / 19.8; -128.5 (Hurricane Marie weakens to a Category 1 hurricane.) – Hurricane Marie weakens to a Category 1 hurricane about 1,205 mi (1,940 km) west-southwest of the southern tip of the Baja California peninsula.[23]
October 5
- 00:00 UTC (5:00 p.m. PDT, October 4) at 20°24′N 129°54′W / 20.4°N 129.9°W / 20.4; -129.9 (Hurricane Marie weakens to a tropical storm.) – Hurricane Marie weakens to a tropical storm about 1,290 mi (2,075 km) west-southwest of the southern tip of the Baja California peninsula.[23]
- 06:00 UTC (1:00 a.m. CDT) at 11°24′N 105°00′W / 11.4°N 105.0°W / 11.4; -105.0 (Tropical Depression Nineteen-E forms.) – Tropical Depression Nineteen-E forms from a tropical wave about 635 mi (1,020 km) southwest of Acapulco, Mexico.[24]
- 18:00 UTC (12:00 p.m. MDT) at 12°30′N 105°18′W / 12.5°N 105.3°W / 12.5; -105.3 (Tropical Depression Nineteen-E intensifies into Tropical Storm Norbert.) – Tropical Depression Nineteen-E intensifies into Tropical Storm Norbert about 455 mi (730 km) south of Manzanillo, Mexico.[24]

October 6
- 12:00 UTC (6:00 a.m. MDT) at 13°54′N 106°24′W / 13.9°N 106.4°W / 13.9; -106.4 (Tropical Storm Norbert attains peak intensity.) – Tropical Storm Norbert attains peak winds of 60 mph (95 km/h) and a minimum barometric pressure of 1,000 mb (29.53 inHg) about 460 mi (740 km) south of Manzanillo, Mexico.[24]
- 18:00 UTC (11:00 a.m. PDT) at 22°12′N 135°24′W / 22.2°N 135.4°W / 22.2; -135.4 (Tropical Storm Marie degenerates to a remnant low.) – Tropical Storm Marie degenerates to a remnant low about 1,280 mi (2,060 km) east of Hilo, Hawaii.[23]
October 8
- 00:00 UTC (6:00 p.m. MDT, October 7) at 13°18′N 106°48′W / 13.3°N 106.8°W / 13.3; -106.8 (Tropical Storm Norbert weakens to a tropical depression.) – Tropical Storm Norbert weakens to a tropical depression about 425 mi (685 km) south-southwest of Manzanillo, Mexico.[24]
October 10
- 00:00 UTC (6:00 p.m. MDT, October 9) at 13°30′N 106°24′W / 13.5°N 106.4°W / 13.5; -106.4 (Tropical Depression Norbert dissipates.) – Tropical Depression Norbert dissipates about 520 mi (835 km) south of Manzanillo, Mexico.[24]
October 13
- 18:00 UTC (12:00 p.m. MDT) at 19°18′N 111°18′W / 19.3°N 111.3°W / 19.3; -111.3 (The remnants of Norbert regenerate into a tropical depression.) – The remnants of Norbert regenerate into a tropical depression just northwest of Socorro Island.[24]
October 14
- 00:00 UTC (6:00 p.m. MDT, October 13) at 20°30′N 112°12′W / 20.5°N 112.2°W / 20.5; -112.2 (Tropical Depression Norbert re-intensifies into a tropical storm.) – Tropical Depression Norbert re-intensifies into a tropical storm about 215 mi (345 km) southwest of the southern tip of the Baja California peninsula.[24]

October 15
- 00:00 UTC (5:00 p.m. PDT, October 14) at 25°00′N 115°18′W / 25.0°N 115.3°W / 25.0; -115.3 (Tropical Storm Norbert degenerates to a remnant low.) – Tropical Storm Norbert degenerates to a remnant low about 185 mi (300 km) south of Punta Eugenia, Mexico.[24]
November
November 3
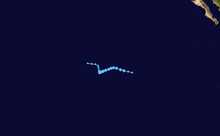
- 18:00 UTC (11:00 a.m. PDT) at 13°42′N 115°30′W / 13.7°N 115.5°W / 13.7; -115.5 (Tropical Storm Odalys forms.) – Tropical Storm Odalys forms from a tropical wave about 730 mi (1,175 km) south-southwest of the southern tip of the Baja California peninsula.[25]
November 5
- 00:00 UTC (5:00 p.m. PDT, November 4) at 17°42′N 121°12′W / 17.7°N 121.2°W / 17.7; -121.2 (Tropical Storm Odalys attains peak intensity.) – Tropical Storm Odalys attains peak winds of 50 mph (85 km/h) and a minimum barometric pressure of 1,000 mb (29.53 inHg) about 810 mi (1,305 km) southwest of the southern tip of the Baja California peninsula.[25]
- 18:00 UTC (11:00 a.m. PDT) at 18°36′N 123°12′W / 18.6°N 123.2°W / 18.6; -123.2 (Tropical Storm Odalys degenerates to a remnant low.) – Tropical Storm Odalys degenerates to a remnant low about 905 mi (1,455 km) southwest of the southern tip of the Baja California peninsula.[25]
November 17
- 18:00 UTC (12:00 p.m. MDT) at 15°00′N 112°54′W / 15.0°N 112.9°W / 15.0; -112.9 (Tropical Depression Twenty-One-E forms.) – Tropical Depression Twenty-One-E forms from a disturbance in the monsoon trough about 575 mi (925 km) south-southwest of the southern tip of the Baja California peninsula.[26]

November 18
- 00:00 UTC (6:00 p.m. MDT, November 17) at 15°24′N 113°48′W / 15.4°N 113.8°W / 15.4; -113.8 (Tropical Depression Twenty-One-E intensifies into Tropical Storm Polo.) – Tropical Depression Twenty-One-E intensifies into Tropical Storm Polo about 570 mi (915 km) south-southwest of the southern tip of the Baja California peninsula.[26]
- 12:00 UTC (5:00 a.m. PDT) at 16°00′N 115°36′W / 16.0°N 115.6°W / 16.0; -115.6 (Tropical Storm Polo attains peak intensity.) – Tropical Storm Polo attains peak winds of 45 mph (75 km/h) and a minimum barometric pressure of 1,004 mb (29.65 inHg) about 600 mi (965 km) south-southwest of the southern tip of the Baja California peninsula.[26]
November 19
- 12:00 UTC (5:00 a.m. PDT) at 17°00′N 119°48′W / 17.0°N 119.8°W / 17.0; -119.8 (Tropical Storm Polo weakens to a tropical depression.) – Tropical Storm Polo weakens to a tropical depression about 760 mi (1,225 km) southwest of the southern tip of the Baja California peninsula.[26]
- 18:00 UTC (11:00 a.m. PDT) at 16°54′N 120°48′W / 16.9°N 120.8°W / 16.9; -120.8 (Tropical Depression Polo degenerates to a remnant low.) – Tropical Depression Polo degenerates to a remnant low about 815 mi (1,310 km) west-southwest of the southern tip of the Baja California peninsula.[26]
November 30
- The 2020 Pacific hurricane season ends in the East Pacific and Central Pacific basins.[1]
See also
 Tropical cyclones portal

Notes
- ^ The tropical cyclone designation is a universal term referring to organized collections of thunderstorms located near a well-defined area of low pressure. Tropical storms, hurricanes, and major hurricanes are all classifications of a tropical cyclone based on their maximum sustained winds within the National Hurricane Center's jurisdiction.[1]
- ^ Hurricanes reaching Category 3 (111 mph (179 km/h)) and higher on the 5-level Saffir–Simpson scale are considered major hurricanes.[2]
- ^ According to the National Hurricane Center's protocol, a tropical cyclone that degenerates into a remnant low in one basin and regenerates in another is given a different name. Since Amanda, a Pacific tropical storm, degenerated over Central America, the regenerated Atlantic tropical cyclone was given the next name on the Atlantic list, Cristobal.[3]
- ^ In a post-season review of Tropical Depression Seven-E, the National Hurricane Center determined that the depression briefly reached tropical storm intensity. Since the depression was not considered a tropical storm while it was initially active, it was not named.[14]
References
- ^ a b c d e "Tropical Cyclone Climatology". Miami, Florida: National Hurricane Center. Retrieved January 23, 2022.
- ^ "Saffir-Simpson Hurricane Wind Scale". Miami, Florida: National Hurricane Center. Retrieved August 6, 2020.
- ^ a b c d e f Robbie Berg (September 10, 2020). Tropical Cyclone Report: Tropical Storm Amanda (PDF) (Report). Miami, Florida: National Hurricane Center. Retrieved November 2, 2020.
- ^ "Moisture from Tropical Storm Fausto fuels NorCal thunderstorms". Los Angeles Times. August 16, 2020. Retrieved January 23, 2022.
- ^ a b c d e f g h i j k Richard Pasch; David Roberts (April 13, 2021). Tropical Cyclone Report: Hurricane Genevieve (PDF) (Report). Miami, Florida: National Hurricane Center. Retrieved January 21, 2022.
- ^ a b c d e John Beven II (March 17, 2021). Tropical Cyclone Report: Tropical Storm Hernan (PDF) (Report). Miami, Florida: National Hurricane Center. Retrieved January 21, 2022.
- ^ Ron Brackett (July 27, 2020). "Hurricane Douglas Blows by Hawaii, Leaving Little Damage Behind". Atlanta, Georgia: The Weather Channel. Retrieved January 23, 2022.
- ^ "Understanding the Date/Time Stamps". Miami, Florida: National Hurricane Center. Retrieved July 20, 2022.
- ^ a b John Cangialosi (June 30, 2020). Tropical Cyclone Report: Tropical Depression One-E (PDF) (Report). Miami, Florida: National Hurricane Center. Retrieved November 2, 2020.
- ^ a b c d Eric Blake; Derek Wroe (January 13, 2021). Tropical Cyclone Report: Tropical Storm Boris (PDF) (Report). Miami, Florida: National Hurricane Center. Retrieved February 4, 2021.
- ^ a b Richard Pasch (March 15, 2021). Tropical Cyclone Report: Tropical Depression Four-E (PDF) (Report). Miami, Florida: National Hurricane Center. Retrieved March 15, 2021.
- ^ a b c d John Beven II; Christopher Landsea (November 13, 2020). Tropical Cyclone Report: Tropical Storm Cristina (PDF) (Report). Miami, Florida: National Hurricane Center. Retrieved March 15, 2021.
- ^ a b Stacy Stewart (December 20, 2020). Tropical Cyclone Report: Tropical Depression Six-E (PDF) (Report). Miami, Florida: National Hurricane Center. Retrieved January 17, 2022.
- ^ a b c Daniel Brown (December 8, 2020). Tropical Cyclone Report: Unnamed Tropical Storm (Formerly Tropical Depression Seven-E) (PDF) (Report). Miami, Florida: National Hurricane Center. Retrieved January 17, 2022.
- ^ a b c d e f g h i j Andy Latto; Jeff Powell (May 25, 2021). Tropical Cyclone Report: Hurricane Douglas (PDF) (Report). Miami, Florida: National Hurricane Center. Retrieved January 20, 2022.
- ^ a b c d e f g John Cangialosi (October 24, 2020). Tropical Cyclone Report: Hurricane Elida (PDF) (Report). Miami, Florida: National Hurricane Center. Retrieved January 20, 2022.
- ^ a b Brad Reinhart (January 4, 2021). Tropical Cyclone Report: Tropical Depression Ten-E (PDF) (Report). Miami, Florida: National Hurricane Center. Retrieved January 20, 2022.
- ^ a b c d Eric Blake (February 10, 2021). Tropical Cyclone Report: Tropical Storm Fausto (PDF) (Report). Miami, Florida: National Hurricane Center. Retrieved January 20, 2022.
- ^ a b c d e Stacy Stewart (February 1, 2021). Tropical Cyclone Report: Tropical Storm Iselle (PDF) (Report). Miami, Florida: National Hurricane Center. Retrieved January 21, 2022.
- ^ a b c d Daniel Brown (January 20, 2021). Tropical Cyclone Report: Tropical Storm Julio (PDF) (Report). Miami, Florida: National Hurricane Center. Retrieved January 21, 2022.
- ^ a b c d Andy Latto (January 29, 2021). Tropical Cyclone Report: Tropical Storm Karina (PDF) (Report). Miami, Florida: National Hurricane Center. Retrieved January 21, 2022.
- ^ a b c d John Cangialosi (December 2, 2020). Tropical Cyclone Report: Tropical Storm Lowell (PDF) (Report). Miami, Florida: National Hurricane Center. Retrieved January 21, 2022.
- ^ a b c d e f g h i j k Philippe Papin (February 18, 2021). Tropical Cyclone Report: Hurricane Marie (PDF) (Report). Miami, Florida: National Hurricane Center. Retrieved January 21, 2022.
- ^ a b c d e f g h Eric Blake (March 15, 2021). Tropical Cyclone Report: Tropical Storm Norbert (PDF) (Report). Miami, Florida: National Hurricane Center. Retrieved January 21, 2022.
- ^ a b c Richard Pasch (April 13, 2021). Tropical Cyclone Report: Tropical Storm Odalys (PDF) (Report). Miami, Florida: National Hurricane Center. Retrieved January 21, 2022.
- ^ a b c d e John Beven II (March 17, 2021). Tropical Cyclone Report: Tropical Storm Polo (PDF) (Report). Miami, Florida: National Hurricane Center. Retrieved January 21, 2022.
External links
Wikimedia Commons has media related to 2020 Pacific hurricane season.
- The National Hurricane Center's advisory archive for 2020


