Timeline of the 2004 Pacific hurricane season
| Timeline of the 2004 Pacific hurricane season | |||||||
|---|---|---|---|---|---|---|---|
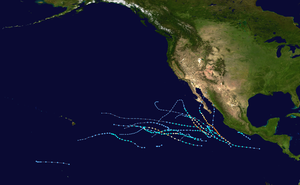 Season summary map | |||||||
| Season boundaries | |||||||
| First system formed | May 22, 2004 | ||||||
| Last system dissipated | October 26, 2004 | ||||||
| Strongest system | |||||||
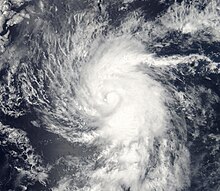
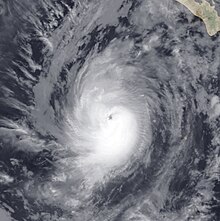
| Name | Javier | ||||||
| Maximum winds | 150 mph (240 km/h) (1-minute sustained) | ||||||
| Lowest pressure | 930 mbar (hPa; 27.46 inHg) | ||||||
| Longest lasting system | |||||||
| Name | Javier | ||||||
| Duration | 9 days | ||||||
| |||||||
| Other years 2002, 2003, 2004, 2005, 2006 | |||||||
The 2004 Pacific hurricane season had 17 tropical cyclones, of which 12 became named storms, 6 became hurricanes, and 3 became major hurricanes (Category 3 or higher).[1][2] This timeline documents all the storm formations, strengthening, weakening, landfalls, extratropical transitions, as well as dissipation. It also includes information which was not operationally released, meaning that information from post-storm reviews by the National Hurricane Center, such as information on a storm that was not operationally warned on, have been included. The season officially began on May 15, 2004, in the eastern Pacific proper (June 1, 2004 in the central Pacific) and lasted until November 30 that same year.[3] Areas east of 140°W are under the purview of the National Hurricane Center (NHC); the area between the International Date Line and 140°W, or the central Pacific, is under the purview of the Central Pacific Hurricane Center (CPHC).
The 2004 season got off to an early start with Tropical Storm Agatha, which formed a week after the season began.[4] No tropical cyclones were active in June, the first such occurrence since 1969.[5] July was more active, producing four tropical cyclones. Three of these (Blas, Celia, and Darby) became named storms, two (Celia and Darby) became hurricanes, and Hurricane Darby became the first major hurricane of the season.[6] Additionally, a tropical depression in the central Pacific became the only tropical cyclone to form within the Central Pacific Hurricane Center's area of responsibility during the year.[1] August was the most active month, producing six tropical cyclones, four named storms, and two hurricanes (Frank and Howard).[7] September saw a decline in activity, although all three storms that existed during the month were hurricanes, two of which (Howard and Javier) were major hurricanes. Hurricane Howard, which had formed in August, only became a major hurricane in September. Hurricane Javier – the final storm during the month – was the strongest storm of the season.[8] October saw the final three tropical cyclones of the year; two developed into named storms (Kay and Lester). Neither of these storms became hurricanes.[9]
Timeline of events

May

May 15
- The 2004 East Pacific hurricane season officially begins.[3]
May 22
- 00:00 UTC (5:00 p.m. PDT, May 21) at 14°42′N 107°36′W / 14.7°N 107.6°W / 14.7; -107.6 (Tropical Depression One-E develops.) – Tropical Depression One-E forms from an area of unsettled weather about 585 mi (945 km) south-southeast of Cabo San Lucas, Baja California Sur.[10]
- 12:00 UTC (5:00 a.m. PDT) at 16°00′N 109°06′W / 16.0°N 109.1°W / 16.0; -109.1 (One-E becomes Tropical Storm Agatha.) – Tropical Depression One-E strengthens into Tropical Storm Agatha about 480 mi (770 km) south of Cabo San Lucas, Baja California Sur.[10]
May 23
- 00:00 UTC (5:00 p.m. PDT, May 22) at 17°06′N 109°54′W / 17.1°N 109.9°W / 17.1; -109.9 (Agatha reaches its peak intensity.) – Tropical Storm Agatha attains peak winds of 60 mph (95 km/h) and a minimum barometric pressure of 997 mbar (29.44 inHg) about 395 mi (640 km) south of Cabo San Lucas, Baja California Sur.[10]
May 24
- 00:00 UTC (5:00 p.m. PDT, May 23) at 18°30′N 110°42′W / 18.5°N 110.7°W / 18.5; -110.7 (Agatha weakens into a tropical depression.) – Tropical Storm Agatha weakens into a tropical depression about 305 mi (490 km) south of Cabo San Lucas, Baja California Sur.[10]
- 12:00 UTC (5:00 a.m. PDT) at 18°54′N 110°54′W / 18.9°N 110.9°W / 18.9; -110.9 (Agatha becomes a remnant low.) – Tropical Depression Agatha degenerates into a remnant low about 280 mi (455 km) south of Cabo San Lucas, Baja California Sur.[10]
June
- No tropical cyclones were active in June.
June 1
- The 2004 Central Pacific hurricane season officially begins.[3]
July
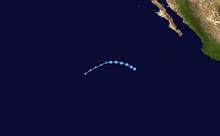
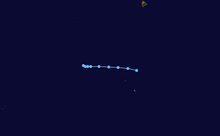
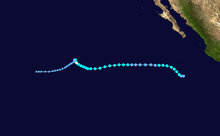
Track maps of tropical depressions Two-E (top) and One-C (bottom), which developed within 48 hours of each other in early July
July 2
- 12:00 UTC (5:00 a.m. PDT) at 16°12′N 119°12′W / 16.2°N 119.2°W / 16.2; -119.2 (Tropical Depression Two-E develops.) – Tropical Depression Two-E forms from a tropical wave about 760 mi (1,225 km) southwest of the southern tip of the Baja California peninsula.[11]
July 3
- 00:00 UTC (5:00 p.m. PDT, July 2) at 17°06′N 120°48′W / 17.1°N 120.8°W / 17.1; -120.8 (Two-E reaches its peak intensity.) – Tropical Depression Two-E attains peak winds of 35 mph (55 km/h) and a minimum barometric pressure of 1,007 mbar (29.74 inHg) about 805 mi (1,295 km) west-southwest of the southern tip of the Baja California peninsula.[11]
July 4
- 00:00 UTC (5:00 p.m. PDT, July 3) at 17°30′N 125°00′W / 17.5°N 125.0°W / 17.5; -125.0 (Two-E becomes a remnant low.) – Tropical Depression Two-E degenerates into a remnant low about 1,040 mi (1,675 km) west-southwest of the southern tip of the Baja California peninsula.[11]
- 00:00 UTC (2:00 p.m. HST, July 3) at 6°00′N 157°00′W / 6.0°N 157.0°W / 6.0; -157.0 (Tropical Depression One-C develops.) – Tropical Depression One-C forms from an Intertropical Convergence Zone (ITCZ) disturbance about 1,130 mi (1,815 km) southeast of Johnston Atoll.[nb 1]
- 18:00 UTC (8:00 a.m. HST) at 6°42′N 162°42′W / 6.7°N 162.7°W / 6.7; -162.7 (One-C reaches its lowest pressure.) – Tropical Depression One-C attains a minimum barometric pressure of 1,007 mbar (29.74 inHg) about 835 mi (1,345 km) southeast of Johnston Atoll.[12][13]
July 5
- 00:00 UTC (2:00 p.m. HST, July 4) at 6°48′N 164°42′W / 6.8°N 164.7°W / 6.8; -164.7 (One-C reaches its highest winds.) – Tropical Depression One-C attains peak winds of 30 mph (45 km/h) about 760 mi (1,225 km) south-southeast of Johnston Atoll.[12][13]
July 6
- 00:00 UTC (2:00 p.m. HST, July 5) at 7°00′N 167°54′W / 7.0°N 167.9°W / 7.0; -167.9 (One-C dissipates.) – Tropical Depression One-C is last noted as a tropical cyclone about 680 mi (1,095 km) south of Johnston Atoll; it dissipates shortly thereafter.[12][13]
July 12
- 12:00 UTC (5:00 a.m. PDT) at 14°36′N 105°30′W / 14.6°N 105.5°W / 14.6; -105.5 (A tropical depression develops.) – A tropical depression forms from a tropical wave about 640 mi (1,030 km) south-southeast of Cabo San Lucas, Baja California Sur.[14]
- 18:00 UTC (11:00 a.m. PDT) at 15°30′N 106°48′W / 15.5°N 106.8°W / 15.5; -106.8 (The depression becomes Tropical Storm Blas.) – The tropical depression strengthens into Tropical Storm Blas about 545 mi (880 km) south-southeast of Cabo San Lucas, Baja California Sur.[14]

July 13
- 12:00 UTC (5:00 a.m. PDT) at 18°24′N 110°48′W / 18.4°N 110.8°W / 18.4; -110.8 (Blas reaches its peak intensity.) – Tropical Storm Blas attains peak winds of 65 mph (100 km/h) and a minimum barometric pressure of 991 mbar (29.26 inHg) about 315 mi (510 km) south of Cabo San Lucas, Baja California Sur.[14]
July 14
- 18:00 UTC (11:00 a.m. PDT) at 22°30′N 117°54′W / 22.5°N 117.9°W / 22.5; -117.9 (Blas weakens into a tropical depression.) – Tropical Storm Blas weakens into a tropical depression about 505 mi (815 km) west of Cabo San Lucas, Baja California Sur.[14]
July 15
- 06:00 UTC (11:00 p.m. PDT, July 14) at 23°12′N 120°24′W / 23.2°N 120.4°W / 23.2; -120.4 (Blas becomes a remnant low.) – Tropical Depression Blas degenerates into a remnant low about 660 mi (1,065 km) west of Cabo San Lucas, Baja California Sur.[14]
July 19
- 00:00 UTC (5:00 p.m. PDT, July 18) at 14°24′N 113°06′W / 14.4°N 113.1°W / 14.4; -113.1 (A tropical depression develops.) – A tropical depression forms from a tropical wave about 620 mi (1,000 km) south-southwest of the southern tip of the Baja California peninsula.[15]
- 12:00 UTC (5:00 a.m. PDT) at 14°42′N 114°54′W / 14.7°N 114.9°W / 14.7; -114.9 (The depression becomes Tropical Storm Celia.) – The tropical depression strengthens into Tropical Storm Celia about 650 mi (1,045 km) south-southwest of the southern tip of the Baja California peninsula.[15]
July 22
- 00:00 UTC (5:00 p.m. PDT, July 21) at 16°18′N 121°00′W / 16.3°N 121.0°W / 16.3; -121.0 (Celia reaches Category 1 status.) – Tropical Storm Celia strengthens into a Category 1 hurricane about 850 mi (1,370 km) west-southwest of the southern tip of the Baja California peninsula.[15]
- 06:00 UTC (11:00 p.m. PDT, July 21) at 16°18′N 121°30′W / 16.3°N 121.5°W / 16.3; -121.5 (Celia reaches its peak intensity.) – Hurricane Celia attains peak winds of 85 mph (140 km/h) and a minimum barometric pressure of 981 mbar (28.97 inHg) about 875 mi (1,410 km) west-southwest of the southern tip of the Baja California peninsula.[15]
- 18:00 UTC (11:00 a.m. PDT) at 16°18′N 123°00′W / 16.3°N 123.0°W / 16.3; -123.0 (Celia weakens into a tropical storm.) – Hurricane Celia weakens into a tropical storm about 960 mi (1,545 km) west-southwest of the southern tip of the Baja California peninsula.[15]

July 24
- 12:00 UTC (5:00 a.m. PDT) at 17°00′N 128°24′W / 17.0°N 128.4°W / 17.0; -128.4 (Celia weakens into a tropical depression.) – Tropical Storm Celia weakens into a tropical depression about 1,260 mi (2,030 km) west-southwest of the southern tip of the Baja California peninsula.[15]
July 26
- 00:00 UTC (5:00 p.m. PDT, July 25) at 19°06′N 135°12′W / 19.1°N 135.2°W / 19.1; -135.2 (Celia becomes a remnant low.) – Tropical Depression Celia degenerates into a remnant low about 1,645 mi (2,650 km) west of the southern tip of the Baja California peninsula.[15]
- 12:00 UTC (5:00 a.m. PDT) at 12°12′N 112°48′W / 12.2°N 112.8°W / 12.2; -112.8 (Tropical Depression Five-E develops.) – Tropical Depression Five-E forms from a tropical wave about 760 mi (1,225 km) south-southwest of Cabo San Lucas, Baja California Sur.[12][16]
July 27
- 00:00 UTC (5:00 p.m. PDT, July 26) at 12°30′N 115°30′W / 12.5°N 115.5°W / 12.5; -115.5 (Five-E becomes Tropical Storm Darby.) – Tropical Depression Five-E strengthens into Tropical Storm Darby about 805 mi (1,295 km) south-southwest of Cabo San Lucas, Baja California Sur.[12][16]
July 28
- 00:00 UTC (5:00 p.m. PDT, July 27) at 14°06′N 120°30′W / 14.1°N 120.5°W / 14.1; -120.5 (Darby reaches Category 1 status.) – Tropical Storm Darby strengthens into a Category 1 hurricane about 915 mi (1,475 km) southwest of Cabo San Lucas, Baja California Sur.[16]
- 18:00 UTC (11:00 a.m. PDT) at 15°48′N 124°00′W / 15.8°N 124.0°W / 15.8; -124.0 (Darby reaches Category 2 status.) – Hurricane Darby strengthens to Category 2 intensity about 1,035 mi (1,670 km) west-southwest of Cabo San Lucas, Baja California Sur.[16]
July 29
- 06:00 UTC (11:00 p.m. PDT, July 28) at 16°48′N 126°12′W / 16.8°N 126.2°W / 16.8; -126.2 (Darby reaches Category 3 status and its peak intensity.) – Hurricane Darby strengthens to Category 3 intensity about 1,135 mi (1,825 km) west-southwest of Cabo San Lucas, Baja California Sur; this makes it the first Pacific major hurricane since Hurricane Kenna in 2002. It simultaneously attains peak winds of 120 mph (195 km/h) and a minimum barometric pressure of 957 mbar (28.26 inHg).[16][17]
- 18:00 UTC (11:00 a.m. PDT) at 17°48′N 128°12′W / 17.8°N 128.2°W / 17.8; -128.2 (Darby weakens to Category 2 status.) – Hurricane Darby weakens to Category 2 intensity about 1,230 mi (1,985 km) west-southwest of Cabo San Lucas, Baja California Sur.[16]
July 30
- 00:00 UTC (5:00 p.m. PDT, July 29) at 18°06′N 129°12′W / 18.1°N 129.2°W / 18.1; -129.2 (Darby weakens to Category 1 status.) – Hurricane Darby weakens to Category 1 intensity about 1,290 mi (2,075 km) west-southwest of Cabo San Lucas, Baja California Sur.[16]
- 12:00 UTC (5:00 a.m. PDT) at 18°24′N 131°42′W / 18.4°N 131.7°W / 18.4; -131.7 (Darby weakens into a tropical storm.) – Hurricane Darby weakens into a tropical storm about 1,440 mi (2,315 km) west-southwest of Cabo San Lucas, Baja California Sur.[16]
July 31
- 12:00 UTC (5:00 a.m. PDT) at 18°48′N 137°18′W / 18.8°N 137.3°W / 18.8; -137.3 (Darby weakens into a tropical depression.) – Tropical Storm Darby weakens into a tropical depression about 1,785 mi (2,870 km) west of Cabo San Lucas, Baja California Sur.[16]
August

August 1
- 00:00 UTC (2:00 p.m. HST, July 31) at 19°00′N 140°24′W / 19.0°N 140.4°W / 19.0; -140.4 (Darby enters the Central Pacific.) – Tropical Depression Darby crosses 140°W, leaving the jurisdiction of the National Hurricane Center (NHC) and entering the Central Pacific Hurricane Center's (CPHC) area of responsibility.[12][16]
- 06:00 UTC (11:00 p.m. PDT, July 31) at 12°24′N 126°06′W / 12.4°N 126.1°W / 12.4; -126.1 (Tropical Depression Six-E develops at its peak intensity.) – Tropical Depression Six-E forms about 1,285 mi (2,065 km) southwest of Cabo San Lucas, Baja California Sur; it simultaneously attains peak winds of 30 mph (45 km/h) and a minimum barometric pressure of 1,008 mbar (29.77 inHg).[17][18]
- 12:00 UTC (2:00 a.m. HST) at 19°30′N 143°48′W / 19.5°N 143.8°W / 19.5; -143.8 (Darby becomes a remnant low.) – Tropical Depression Darby degenerates into a remnant low about 920 mi (1,480 km) east of Honolulu, Hawaii.[nb 2]
August 2
- 00:00 UTC (5:00 p.m. PDT, August 1) at 12°00′N 127°48′W / 12.0°N 127.8°W / 12.0; -127.8 (Six-E dissipates.) – Tropical Depression Six-E is last noted as a tropical cyclone about 1,395 mi (2,240 km) southwest of Cabo San Lucas, Baja California Sur; it dissipates six hours later.[17][18]
August 19
- 06:00 UTC (11:00 p.m. PDT, August 18) at 11°36′N 131°48′W / 11.6°N 131.8°W / 11.6; -131.8 (A tropical depression develops.) – A tropical depression forms from an area of unsettled weather about 1,645 mi (2,650 km) east-southeast of Hilo, Hawaii.[19]
August 20
- 06:00 UTC (11:00 p.m. PDT, August 19) at 13°36′N 136°18′W / 13.6°N 136.3°W / 13.6; -136.3 (The depression becomes Tropical Storm Estelle.) – The aforementioned tropical depression strengthens into Tropical Storm Estelle about 1,310 mi (2,115 km) east-southeast of Hilo, Hawaii.[19]
August 21
- 06:00 UTC (8:00 p.m. HST, August 20) at 14°36′N 140°06′W / 14.6°N 140.1°W / 14.6; -140.1 (Estelle enters the Central Pacific.) – Tropical Storm Estelle crosses 140°W, leaving the jurisdiction of the NHC and entering the CPHC's area of responsibility.[12][19]
- 12:00 UTC (2:00 a.m. HST) at 15°00′N 140°48′W / 15.0°N 140.8°W / 15.0; -140.8 (Estelle reaches its peak intensity.) – Tropical Storm Estelle attains peak winds of 70 mph (110 km/h) and a minimum barometric pressure of 989 mbar (29.21 inHg) about 995 mi (1,605 km) east-southeast of Hilo, Hawaii.[12][19]
August 23
- 00:00 UTC (2:00 p.m. HST, August 22) at 16°24′N 143°24′W / 16.4°N 143.4°W / 16.4; -143.4 (Estelle weakens into a tropical depression.) – Tropical Storm Estelle weakens into a tropical depression about 800 mi (1,290 km) east-southeast of Hilo, Hawaii.[12][19]
- 06:00 UTC (11:00 p.m. PDT, August 22) at 16°42′N 110°12′W / 16.7°N 110.2°W / 16.7; -110.2 (A tropical depression develops.) – A tropical depression forms from the remnants of Atlantic Tropical Storm Earl about 425 mi (685 km) south of Cabo San Lucas, Baja California Sur.[20]
- 12:00 UTC (5:00 a.m. PDT) at 17°18′N 111°12′W / 17.3°N 111.2°W / 17.3; -111.2 (The depression becomes Tropical Storm Frank.) – The tropical depression strengthens into Tropical Storm Frank about 390 mi (630 km) south of Cabo San Lucas, Baja California Sur.[20]
- 18:00 UTC (11:00 a.m. PDT) at 18°00′N 112°00′W / 18.0°N 112.0°W / 18.0; -112.0 (Frank reaches Category 1 status.) – Tropical Storm Frank strengthens into a Category 1 hurricane about 370 mi (595 km) south-southwest of Cabo San Lucas, Baja California Sur.[20]
- 18:00 UTC (11:00 a.m. PDT) at 17°18′N 123°36′W / 17.3°N 123.6°W / 17.3; -123.6 (Tropical Depression Nine-E develops.) – Tropical Depression Nine-E forms from a tropical wave about 965 mi (1,555 km) west-southwest of Cabo San Lucas, Baja California Sur.[21]
August 24
- 00:00 UTC (5:00 p.m. PDT, August 23) at 17°48′N 123°42′W / 17.8°N 123.7°W / 17.8; -123.7 (Nine-E reaches its highest winds.) – Tropical Depression Nine-E attains peak winds of 35 mph (55 km/h) about 955 mi (1,540 km) west-southwest of Cabo San Lucas, Baja California Sur.[21]
- 06:00 UTC (11:00 p.m. PDT, August 23) at 19°30′N 113°42′W / 19.5°N 113.7°W / 19.5; -113.7 (Frank reaches its peak intensity.) – Hurricane Frank attains peak winds of 85 mph (140 km/h) and a minimum barometric pressure of 979 mbar (28.91 inHg) about 335 mi (535 km) southwest of Cabo San Lucas, Baja California Sur.[20]
- 06:00 UTC (11:00 p.m. PDT, August 23) at 18°12′N 123°54′W / 18.2°N 123.9°W / 18.2; -123.9 (Nine-E reaches its lowest pressure.) – Tropical Depression Nine-E attains a minimum barometric pressure of 1,005 mbar (29.68 inHg) about 955 mi (1,540 km) west-southwest of Cabo San Lucas, Baja California Sur.[21]
- 18:00 UTC (8:00 a.m. HST) at 15°00′N 150°30′W / 15.0°N 150.5°W / 15.0; -150.5 (Estelle becomes a remnant low.) – Tropical Depression Estelle degenerates into a remnant low about 445 mi (715 km) southeast of Hilo, Hawaii.[12][19]
August 25
- 06:00 UTC (11:00 p.m. PDT, August 24) at 21°36′N 116°12′W / 21.6°N 116.2°W / 21.6; -116.2 (Frank weakens into a tropical storm.) – Hurricane Frank weakens into a tropical storm about 410 mi (660 km) west-southwest of Cabo San Lucas, Baja California Sur.[20]

August 26
- 00:00 UTC (5:00 p.m. PDT, August 25) at 22°06′N 118°18′W / 22.1°N 118.3°W / 22.1; -118.3 (Frank weakens into a tropical depression.) – Tropical Storm Frank weakens into a tropical depression about 535 mi (860 km) west of Cabo San Lucas, Baja California Sur.[20]
- 06:00 UTC (11:00 p.m. PDT, August 25) at 22°18′N 119°00′W / 22.3°N 119.0°W / 22.3; -119.0 (Frank becomes a remnant low.) – Tropical Depression Frank degenerates into a remnant low about 575 mi (925 km) west of Cabo San Lucas, Baja California Sur.[20]
- 12:00 UTC (5:00 a.m. PDT) at 14°42′N 106°00′W / 14.7°N 106.0°W / 14.7; -106.0 (A tropical depression develops.) – A tropical depression forms from a tropical wave about 620 mi (1,000 km) south-southeast of the southern tip of the Baja California peninsula.[22]
- 18:00 UTC (11:00 a.m. PDT) at 19°54′N 131°54′W / 19.9°N 131.9°W / 19.9; -131.9 (Nine-E becomes a remnant low.) – Tropical Depression Nine-E degenerates into a remnant low about 1,420 mi (2,290 km) west of Cabo San Lucas, Baja California Sur.[21]
- 18:00 UTC (11:00 a.m. PDT) at 15°36′N 107°00′W / 15.6°N 107.0°W / 15.6; -107.0 (The depression becomes Tropical Storm Georgette.) – The tropical depression that had formed six hours earlier strengthens into Tropical Storm Georgette about 540 mi (870 km) south-southeast of the southern tip of the Baja California peninsula.[22]
August 27
- 12:00 UTC (5:00 a.m. PDT) at 17°54′N 111°18′W / 17.9°N 111.3°W / 17.9; -111.3 (Georgette reaches its peak intensity.) – Tropical Storm Georgette attains peak winds of 65 mph (100 km/h) and a minimum barometric pressure of 995 mbar (29.38 inHg) about 355 mi (575 km) south-southwest of the southern tip of the Baja California peninsula.[22]
August 30
- 06:00 UTC (11:00 p.m. PDT, August 29) at 19°54′N 123°24′W / 19.9°N 123.4°W / 19.9; -123.4 (Georgette weakens into a tropical depression.) – After oscillating between winds of 50 mph (85 km/h) and 60 mph (95 km/h) for two days, Tropical Storm Georgette weakens into a tropical depression about 885 mi (1,425 km) west-southwest of the southern tip of the Baja California peninsula.[22]
- 12:00 UTC (5:00 a.m. PDT) at 11°54′N 103°06′W / 11.9°N 103.1°W / 11.9; -103.1 (A tropical depression develops.) – A tropical depression forms from a tropical wave about 405 mi (650 km) south-southwest of Acapulco, Guerrero.[23]
- 18:00 UTC (11:00 a.m. PDT) at 20°18′N 125°36′W / 20.3°N 125.6°W / 20.3; -125.6 (Georgette becomes a remnant low.) – Tropical Depression Georgette degenerates into a remnant low about 1,020 mi (1,640 km) west of the southern tip of the Baja California peninsula.[22]
August 31
- 00:00 UTC (5:00 p.m. PDT, August 30) at 13°18′N 104°36′W / 13.3°N 104.6°W / 13.3; -104.6 (The depression becomes Tropical Storm Howard.) – The tropical depression that had formed 12 hours prior strengthens into Tropical Storm Howard about 395 mi (640 km) southwest of Acapulco, Guerrero.[23]
September
September 1

- 06:00 UTC (11:00 p.m. PDT, August 31) at 15°30′N 109°30′W / 15.5°N 109.5°W / 15.5; -109.5 (Howard reaches Category 1 status.) – Tropical Storm Howard strengthens into a Category 1 hurricane about 645 mi (1,040 km) west of Acapulco, Guerrero.[23]
September 2
- 06:00 UTC (11:00 p.m. PDT, September 1) at 17°18′N 112°36′W / 17.3°N 112.6°W / 17.3; -112.6 (Howard quickly reaches Category 3 status.) – Hurricane Howard rapidly strengthens to Category 3 intensity, skipping Category 2 status, about 840 mi (1,355 km) west of Acapulco, Guerrero; this makes it the second major hurricane of the season.[23]
- 12:00 UTC (5:00 a.m. PDT) at 17°48′N 113°18′W / 17.8°N 113.3°W / 17.8; -113.3 (Howard reaches Category 4 status and its peak intensity.) – Hurricane Howard strengthens to Category 4 intensity about 885 mi (1,425 km) west of Acapulco, Guerrero; it simultaneously attains peak winds of 140 mph (220 km/h) and a minimum barometric pressure of 943 mbar (27.85 inHg).[23]
September 3
- 06:00 UTC (11:00 p.m. PDT, September 2) at 19°12′N 114°54′W / 19.2°N 114.9°W / 19.2; -114.9 (Howard weakens to Category 3 status.) – Hurricane Howard weakens to Category 3 intensity about 600 mi (965 km) south of Punta Eugenia, Baja California Sur.[23]
- 12:00 UTC (5:00 a.m. PDT) at 19°54′N 115°24′W / 19.9°N 115.4°W / 19.9; -115.4 (Howard weakens to Category 2 status.) – Hurricane Howard weakens to Category 2 intensity about 545 mi (880 km) south of Punta Eugenia, Baja California Sur.[23]
- 18:00 UTC (11:00 a.m. PDT) at 20°48′N 115°54′W / 20.8°N 115.9°W / 20.8; -115.9 (Howard weakens to Category 1 status.) – Hurricane Howard weakens to Category 1 intensity about 490 mi (790 km) south of Punta Eugenia, Baja California Sur.[23]
September 4
- 12:00 UTC (5:00 a.m. PDT) at 23°12′N 117°30′W / 23.2°N 117.5°W / 23.2; -117.5 (Howard weakens into a tropical storm.) – Hurricane Howard weakens into a tropical storm about 355 mi (575 km) south-southwest of Punta Eugenia, Baja California Sur.[23]
September 5
- 06:00 UTC (11:00 p.m. PDT, September 4) at 24°48′N 118°30′W / 24.8°N 118.5°W / 24.8; -118.5 (Howard weakens into a tropical depression.) – Tropical Storm Howard weakens into a tropical depression about 300 mi (480 km) southwest of Punta Eugenia, Baja California Sur.[23]
- 18:00 UTC (11:00 a.m. PDT) at 26°00′N 118°48′W / 26.0°N 118.8°W / 26.0; -118.8 (Howard becomes a remnant low.) – Tropical Depression Howard degenerates into a remnant low about 265 mi (425 km) west-southwest of Punta Eugenia, Baja California Sur.[23]
September 8
- 06:00 UTC (11:00 p.m. PDT, September 7) at 15°06′N 109°54′W / 15.1°N 109.9°W / 15.1; -109.9 (A tropical depression develops.) – A tropical depression forms from a tropical wave about 535 mi (860 km) south of Cabo San Lucas, Baja California Sur.[24]
- 18:00 UTC (11:00 a.m. PDT) at 15°24′N 110°48′W / 15.4°N 110.8°W / 15.4; -110.8 (The depression becomes Tropical Storm Isis.) – The tropical depression strengthens into Tropical Storm Isis about 520 mi (835 km) south of Cabo San Lucas, Baja California Sur.[24]
September 10
- 00:00 UTC (5:00 p.m. PDT, September 9) at 17°18′N 114°06′W / 17.3°N 114.1°W / 17.3; -114.1 (Isis reaches its initial peak intensity.) – Tropical Storm Isis reaches its initial peak intensity, with winds of 45 mph (75 km/h) and a barometric pressure of 1,002 mbar (29.59 inHg), about 470 mi (760 km) southwest of Cabo San Lucas, Baja California Sur.[24]
- 12:00 UTC (5:00 a.m. PDT) at 17°18′N 115°42′W / 17.3°N 115.7°W / 17.3; -115.7 (Isis weakens into a tropical depression.) – Tropical Storm Isis weakens into a tropical depression about 535 mi (860 km) southwest of Cabo San Lucas, Baja California Sur.[24]
- 18:00 UTC (11:00 a.m. PDT) at 11°12′N 93°30′W / 11.2°N 93.5°W / 11.2; -93.5 (A tropical depression develops.) – A tropical depression forms from a tropical wave about 365 mi (585 km) south-southeast of Salina Cruz, Oaxaca.[25]
September 11
- 12:00 UTC (5:00 a.m. PDT) at 11°42′N 97°48′W / 11.7°N 97.8°W / 11.7; -97.8 (The depression becomes Tropical Storm Javier.) – The tropical depression that had formed 18 hours prior strengthens into Tropical Storm Javier about 355 mi (575 km) south-southwest of Salina Cruz, Oaxaca.[25]
September 12
- 00:00 UTC (5:00 p.m. PDT, September 11) at 17°24′N 121°18′W / 17.4°N 121.3°W / 17.4; -121.3 (Isis regains tropical storm status.) – Tropical Depression Isis restrengthens into a tropical storm about 830 mi (1,335 km) west-southwest of Cabo San Lucas, Baja California Sur.[24]
- 18:00 UTC (11:00 a.m. PDT) at 13°06′N 103°24′W / 13.1°N 103.4°W / 13.1; -103.4 (Javier reaches Category 1 status.) – Tropical Storm Javier strengthens into a Category 1 hurricane about 415 mi (665 km) south of Manzanillo, Colima.[25]
September 13

- 06:00 UTC (11:00 p.m. PDT, September 12) at 14°06′N 104°48′W / 14.1°N 104.8°W / 14.1; -104.8 (Javier reaches Category 2 status.) – Hurricane Javier strengthens to Category 2 intensity about 345 mi (555 km) south of Manzanillo, Colima.[25]
- 12:00 UTC (5:00 a.m. PDT) at 14°42′N 105°24′W / 14.7°N 105.4°W / 14.7; -105.4 (Javier reaches Category 3 status.) – Hurricane Javier strengthens to Category 3 intensity about 310 mi (500 km) south-southwest of Manzanillo, Colima, making it the third and final major hurricane of the season.[25]
- 18:00 UTC (11:00 a.m. PDT) at 15°12′N 106°06′W / 15.2°N 106.1°W / 15.2; -106.1 (Javier reaches Category 4 status.) – Hurricane Javier strengthens to Category 4 intensity about 295 mi (475 km) south-southwest of Manzanillo, Colima.[25]
September 14
- 00:00 UTC (5:00 p.m. PDT, September 13) at 15°54′N 106°48′W / 15.9°N 106.8°W / 15.9; -106.8 (Javier, the season's strongest storm, reaches its peak intensity.) – Hurricane Javier attains peak winds of 150 mph (240 km/h) and a minimum barometric pressure of 930 mbar (27.46 inHg) about 270 mi (435 km) southwest of Manzanillo, Colima, making it the strongest storm of the season.[25]
September 15
- 12:00 UTC (5:00 a.m. PDT) at 17°48′N 131°48′W / 17.8°N 131.8°W / 17.8; -131.8 (Isis reaches Category 1 status.) – Tropical Storm Isis strengthens into a Category 1 hurricane about 1,455 mi (2,345 km) west-southwest of Cabo San Lucas, Baja California Sur; it simultaneously attains peak winds of 75 mph (120 km/h) and a minimum barometric pressure of 987 mbar (29.15 inHg).[24]
- 18:00 UTC (11:00 a.m. PDT) at 18°12′N 132°00′W / 18.2°N 132.0°W / 18.2; -132.0 (Isis weakens into a tropical storm.) – Hurricane Isis weakens into a tropical storm about 1,460 mi (2,355 km) west-southwest of Cabo San Lucas, Baja California Sur.[24]
September 16

- 00:00 UTC (5:00 p.m. PDT, September 15) at 18°54′N 109°30′W / 18.9°N 109.5°W / 18.9; -109.5 (Javier weakens to Category 3 status.) – Hurricane Javier weakens to Category 3 intensity about 340 mi (545 km) west of Manzanillo, Colima.[25]
- 12:00 UTC (5:00 a.m. PDT) at 18°12′N 132°12′W / 18.2°N 132.2°W / 18.2; -132.2 (Isis weakens into a tropical depression.) – Tropical Storm Isis weakens into a tropical depression about 1,475 mi (2,370 km) west of Cabo San Lucas, Baja California Sur.[24]
- 18:00 UTC (11:00 a.m. PDT) at 18°00′N 132°18′W / 18.0°N 132.3°W / 18.0; -132.3 (Isis becomes a remnant low.) – Tropical Depression Isis degenerates into a remnant low about 1,485 mi (2,390 km) west-southwest of Cabo San Lucas, Baja California Sur.[24]
September 17
- 12:00 UTC (5:00 a.m. PDT) at 21°30′N 111°54′W / 21.5°N 111.9°W / 21.5; -111.9 (Javier weakens to Category 2 status.) – Hurricane Javier weakens to Category 2 intensity about 230 mi (370 km) south of Cabo San Lázaro, Baja California Sur.[25]
September 18
- 00:00 UTC (5:00 p.m. PDT, September 17) at 22°24′N 112°24′W / 22.4°N 112.4°W / 22.4; -112.4 (Javier weakens to Category 1 status.) – Hurricane Javier weakens to Category 1 intensity about 165 mi (270 km) south of Cabo San Lázaro, Baja California Sur.[25]
- 12:00 UTC (5:00 a.m. PDT) at 23°18′N 113°12′W / 23.3°N 113.2°W / 23.3; -113.2 (Javier weakens into a tropical storm.) – Hurricane Javier weakens into a tropical storm about 115 mi (185 km) south-southwest of Cabo San Lázaro, Baja California Sur.[25]
September 19
- 00:00 UTC (5:00 p.m. PDT, September 18) at 24°48′N 113°30′W / 24.8°N 113.5°W / 24.8; -113.5 (Javier weakens into a tropical depression.) – Tropical Storm Javier weakens into a tropical depression about 75 mi (120 km) west of Cabo San Lázaro, Baja California Sur.[25]
- 11:00 UTC (4:00 a.m. PDT) at 26°36′N 113°00′W / 26.6°N 113.0°W / 26.6; -113.0 (Javier makes landfall.) – Tropical Depression Javier makes landfall on the west coast of Baja California Sur, about 35 mi (55 km) east-southeast of Punta Abreojos, with winds of 30 mph (45 km/h) and a barometric pressure of 1,003 mbar (29.62 inHg).[25]
- 18:00 UTC (11:00 a.m. PDT) at 28°30′N 112°00′W / 28.5°N 112.0°W / 28.5; -112.0 (Javier becomes a remnant low.) – Tropical Depression Javier degenerates into a remnant low over the north-central Gulf of California, about 80 mi (130 km) west-northwest of Guaymas, Sonora.[25]
October
October 4
- 18:00 UTC (11:00 a.m. PDT) at 13°48′N 111°18′W / 13.8°N 111.3°W / 13.8; -111.3 (Tropical Depression Fourteen-E develops.) – Tropical Depression Fourteen-E forms from an ITCZ disturbance about 585 mi (945 km) southwest of Manzanillo, Colima.[26]
October 5

- 06:00 UTC (11:00 p.m. PDT, October 4) at 14°06′N 114°00′W / 14.1°N 114.0°W / 14.1; -114.0 (Fourteen-E becomes Tropical Storm Kay.) – Tropical Depression Fourteen-E strengthens into Tropical Storm Kay about 725 mi (1,165 km) west-southwest of Manzanillo, Colima.[26]
- 12:00 UTC (5:00 a.m. PDT) at 14°24′N 115°06′W / 14.4°N 115.1°W / 14.4; -115.1 (Kay reaches its peak intensity.) – Tropical Storm Kay attains peak winds of 45 mph (75 km/h) and a minimum barometric pressure of 1,004 mbar (29.65 inHg) about 785 mi (1,260 km) west-southwest of Manzanillo, Colima.[26]
- 18:00 UTC (11:00 a.m. PDT) at 15°00′N 116°00′W / 15.0°N 116.0°W / 15.0; -116.0 (Kay weakens into a tropical depression.) – Tropical Storm Kay weakens into a tropical depression about 825 mi (1,325 km) west-southwest of Manzanillo, Colima.[26]
October 6
- 12:00 UTC (5:00 a.m. PDT) at 16°06′N 117°12′W / 16.1°N 117.2°W / 16.1; -117.2 (Kay becomes a remnant low.) – Tropical Depression Kay degenerates into a remnant low about 875 mi (1,410 km) west-southwest of Manzanillo, Colima.[26]
October 11

- 18:00 UTC (11:00 a.m. PDT) at 14°24′N 96°42′W / 14.4°N 96.7°W / 14.4; -96.7 (A tropical depression develops.) – A tropical depression forms from an area of unsettled weather about 105 mi (165 km) south-southeast of Puerto Escondido, Oaxaca.[27]
October 12
- 18:00 UTC (11:00 a.m. PDT) at 16°12′N 99°12′W / 16.2°N 99.2°W / 16.2; -99.2 (The depression becomes Tropical Storm Lester.) – The aforementioned tropical depression strengthens into Tropical Storm Lester about 65 mi (100 km) southeast of Acapulco, Guerrero.[27]
October 13
- 00:00 UTC (5:00 p.m. PDT, October 12) at 16°24′N 99°36′W / 16.4°N 99.6°W / 16.4; -99.6 (Lester reaches its peak intensity.) – Tropical Storm Lester attains peak winds of 50 mph (85 km/h) and a minimum barometric pressure of 1,000 mbar (29.53 inHg) about 35 mi (55 km) south-southeast of Acapulco, Guerrero.[27]
- 12:00 UTC (5:00 a.m. PDT) at 16°42′N 100°36′W / 16.7°N 100.6°W / 16.7; -100.6 (Lester weakens into a tropical depression before dissipating.) – Tropical Storm Lester weakens into a tropical depression about 45 mi (75 km) west-southwest of Acapulco, Guerrero; it dissipates six hours later.[27]
October 25
- 00:00 UTC (5:00 p.m. PDT, October 24) at 18°18′N 109°12′W / 18.3°N 109.2°W / 18.3; -109.2 (Tropical Depression Sixteen-E develops.) – Tropical Depression Sixteen-E forms from a tropical wave about 320 mi (520 km) south of the southern tip of the Baja California peninsula.[28]
- 06:00 UTC (11:00 p.m. PDT, October 24) at 19°18′N 109°06′W / 19.3°N 109.1°W / 19.3; -109.1 (Sixteen-E reaches its highest winds.) – Tropical Depression Sixteen-E attains peak winds of 35 mph (55 km/h) about 255 mi (410 km) south-southeast of the southern tip of the Baja California peninsula.[28]
October 26

- 00:00 UTC (5:00 p.m. PDT, October 25) at 23°36′N 108°36′W / 23.6°N 108.6°W / 23.6; -108.6 (Sixteen-E reaches its lowest pressure.) – Tropical Depression Sixteen-E attains a minimum barometric pressure of 1,004 mbar (29.65 inHg) about 100 mi (155 km) east-northeast of the southern tip of the Baja California peninsula.[28]
- 10:00 UTC (3:00 a.m. PDT) at 25°24′N 108°48′W / 25.4°N 108.8°W / 25.4; -108.8 (Sixteen-E makes landfall.) – Tropical Depression Sixteen-E makes landfall near Topolobampo and Guasave in the Mexican state of Sinaloa with winds of 35 mph (55 km/h) and a barometric pressure of 1,005 mbar (29.68 inHg).[28]
- 18:00 UTC (11:00 a.m. PDT) at 25°48′N 108°48′W / 25.8°N 108.8°W / 25.8; -108.8 (Sixteen-E dissipates.) – Tropical Depression Sixteen-E is last noted inland about 25 mi (35 km) northeast of Topolobampo, or about 25 mi (35 km) northwest of Guasave; it dissipates six hours later over the Sierra Madre Occidental.[28]
November
- No tropical cyclones were active in November.
November 30
- The 2004 Pacific hurricane season officially ends.[3]
See also
 Tropical cyclones portal

- Timeline of the 2004 Atlantic hurricane season
- Timeline of the 2004 Pacific typhoon season
- Timelines of the South Pacific cyclone seasons: 2003–04, 2004–05
Notes
- ^ While the Central Pacific Hurricane Center's (CPHC) year-end report on tropical activity within their area of responsibility in 2004 stated that Tropical Depression One-C formed at 00:00 UTC on July 5,[12] the system's listing in the Eastern and Central Pacific hurricane database (HURDAT) begins 24 hours earlier, at 00:00 UTC on July 4.[13]
- ^ The position of Darby's remnants at 12:00 UTC on August 1 is based solely on the CPHC's 2004 year-end report;[12] neither HURDAT nor the National Hurricane Center's Tropical Cyclone Report for Darby provide coordinates for where it ceased to be a tropical cyclone.[13][16]
References
- ^ a b Nash, Andy; Craig, Tim; Matsuda, Roy; Powell, Jeffrey (February 2005). "Overview of the 2004 Central North Pacific Tropical Cyclone Season". Central Pacific Hurricane Center. Retrieved November 12, 2010.
- ^ Avila, Lixion A.; Pasch, Richard J.; Beven II, John L.; Franklin, James L.; Lawrence, Miles B.; Stewart, Stacy R. (August 2, 2005). "Annual Summary: Eastern North Pacific Hurricane Season of 2004". Monthly Weather Review. 134 (3). American Meteorological Society: 1026. Bibcode:2006MWRv..134.1026A. doi:10.1175/MWR3095.1.
- ^ a b c d "FAQ: When is hurricane season?". Atlantic Oceanographic and Meteorological Laboratory. Retrieved November 12, 2010.
- ^ Avila (June 1, 2004). "Tropical Weather Summary for May 2004". National Hurricane Center. Retrieved November 18, 2010.
- ^ Stewart; Avila (July 1, 2004). "Tropical Weather Summary for June 2004". National Hurricane Center. Retrieved November 13, 2010.
- ^ Stewart; Lawrence; Pasch; Beven; Franklin (August 1, 2004). "Tropical Weather Summary for July 2004". National Hurricane Center. Retrieved November 18, 2010.
- ^ Blake; Franklin (September 1, 2004). "Tropical Weather Summary for August 2004". National Hurricane Center. Retrieved November 19, 2010.
- ^ Pasch; Stewart; Avila; Beven (October 1, 2004). "Tropical Weather Summary for September 2004". National Hurricane Center. Retrieved November 19, 2010.
- ^ Stewart; Avila; Beven; Lawrence; Franklin; Pasch (November 1, 2004). "Tropical Weather Summary for October 2004". National Hurricane Center. Retrieved November 19, 2010.
- ^ a b c d e Avila, Lixion A. (June 2, 2004). Tropical Cyclone Report: Tropical Storm Agatha (PDF) (Report). Miami, Florida: National Hurricane Center. Archived (PDF) from the original on December 16, 2023. Retrieved August 3, 2009.
- ^ a b c Lawrence, Miles B. (July 17, 2004). Tropical Cyclone Report: Tropical Depression Two-E (PDF) (Report). Miami, Florida: National Hurricane Center. Archived (PDF) from the original on November 1, 2023. Retrieved August 3, 2009.
- ^ a b c d e f g h i j k l Nash, Andy; Craig, Tim; Matsuda, Roy; Powell, Jeffrey (February 2005). 2004 Tropical Cyclones Central North Pacific (PDF) (NOAA Technical Memorandum NWSTM PR-52). Honolulu, Hawaii: Central Pacific Hurricane Center. Archived (PDF) from the original on April 18, 2024. Retrieved July 20, 2024.
- ^ a b c d e National Hurricane Center; Hurricane Research Division; Central Pacific Hurricane Center (April 26, 2024). "The Northeast and North Central Pacific hurricane database 1949–2023". United States National Oceanic and Atmospheric Administration's National Weather Service. Archived from the original on May 29, 2024. A guide on how to read the database is available here.
 This article incorporates text from this source, which is in the public domain.
 - ^ a b c d e Pasch, Richard J. (August 5, 2004). Tropical Cyclone Report: Tropical Storm Blas (PDF) (Report). Miami, Florida: National Hurricane Center. Archived (PDF) from the original on December 16, 2023. Retrieved August 3, 2009.
- ^ a b c d e f g Stewart, Stacy R. (October 12, 2004). Tropical Cyclone Report: Hurricane Celia (PDF) (Report). Miami, Florida: National Hurricane Center. Archived (PDF) from the original on July 15, 2023. Retrieved August 3, 2009.
- ^ a b c d e f g h i j k Beven, Jack (December 17, 2004). Tropical Cyclone Report: Hurricane Darby (PDF) (Report). Miami, Florida: National Hurricane Center. Archived (PDF) from the original on November 1, 2023. Retrieved November 11, 2010.
- ^ a b c Avila, Lixion; Beven, Jack; Franklin, James; Lawrence, Miles; Pasch, Richard; Stewart, Stacy (December 1, 2004). Tropical Weather Summary (Report). Miami, Florida: National Hurricane Center. Archived from the original on April 6, 2024. Retrieved November 12, 2010.
- ^ a b Franklin, James L.; Knabb, Richard D. (November 16, 2004). Abbreviated Tropical Cyclone Report: Tropical Depression Six-E (PDF) (Report). Miami, Florida: National Hurricane Center. Archived (PDF) from the original on November 1, 2023. Retrieved November 11, 2010.
- ^ a b c d e f Avila, Lixion A. (November 3, 2004). Tropical Cyclone Report: Tropical Storm Estelle (PDF) (Report). Miami, Florida: National Hurricane Center. Archived (PDF) from the original on December 16, 2023. Retrieved November 11, 2010.
- ^ a b c d e f g Roberts, David P.; Lawrence, Miles B. (November 19, 2004). Tropical Cyclone Report: Hurricane Frank (PDF) (Report). Miami, Florida: National Hurricane Center. Archived (PDF) from the original on July 15, 2023. Retrieved November 11, 2010.
- ^ a b c d Pasch, Richard J. Abbreviated Tropical Cyclone Report: Tropical Depression Nine-E (PDF) (Report). Miami, Florida: National Hurricane Center. Archived (PDF) from the original on November 1, 2023. Retrieved November 11, 2010.
- ^ a b c d e Stewart, Stacy R. Tropical Cyclone Report: Tropical Storm Georgette (PDF) (Report). Miami, Florida: National Hurricane Center. Archived (PDF) from the original on December 16, 2023. Retrieved November 11, 2010.
- ^ a b c d e f g h i j k Beven, Jack. Tropical Cyclone Report: Hurricane Howard (PDF) (Report). Miami, Florida: National Hurricane Center. Archived (PDF) from the original on September 7, 2023. Retrieved November 12, 2010.
- ^ a b c d e f g h i Franklin, James L.; Roberts, David P. (November 17, 2004). Tropical Cyclone Report: Hurricane Isis (PDF) (Report). Miami, Florida: National Hurricane Center. Archived (PDF) from the original on July 15, 2023. Retrieved November 12, 2010.
- ^ a b c d e f g h i j k l m n Avila, Lixion A. "Tropical Cyclone Report: Hurricane Javier" (PDF). Miami, Florida: National Hurricane Center. Archived (PDF) from the original on April 9, 2023. Retrieved November 12, 2010.
- ^ a b c d e Roberts, David P.; Lawrence, Miles B. (November 20, 2004). Tropical Cyclone Report: Tropical Storm Kay (PDF) (Report). Miami, Florida: National Hurricane Center. Archived (PDF) from the original on December 16, 2023. Retrieved November 12, 2010.
- ^ a b c d Pasch, Richard J.; Roberts, David P. (December 10, 2004). "Tropical Cyclone Report: Tropical Storm Lester" (PDF). Miami, Florida: National Hurricane Center. Archived (PDF) from the original on December 16, 2023. Retrieved November 12, 2010.
- ^ a b c d e Stewart, Stacy R. (November 18, 2004). Tropical Cyclone Report: Tropical Depression Sixteen-E (PDF) (Report). Miami, Florida: National Hurricane Center. Archived (PDF) from the original on October 31, 2023. Retrieved November 12, 2010.
External links
- National Hurricane Center
- Central Pacific Hurricane Center Archived 2011-09-23 at the Wayback Machine


