Rastrigin function
Function used as a performance test problem for optimization algorithms
Rastrigin function of two variables

In 3D
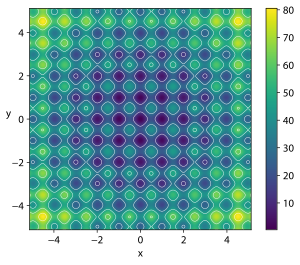
Contour
In mathematical optimization, the Rastrigin function is a non-convex function used as a performance test problem for optimization algorithms. It is a typical example of non-linear multimodal function. It was first proposed in 1974 by Rastrigin[1] as a 2-dimensional function and has been generalized by Rudolph.[2] The generalized version was popularized by Hoffmeister & Bäck[3] and Mühlenbein et al.[4] Finding the minimum of this function is a fairly difficult problem due to its large search space and its large number of local minima.
On an -dimensional domain it is defined by:

![{\displaystyle f(\mathbf {x} )=An+\sum _{i=1}^{n}\left[x_{i}^{2}-A\cos(2\pi x_{i})\right]}](https://wikimedia.org/api/rest_v1/media/math/render/svg/1aa1c38ee739ca9cf4582867d74d469df4676cbc)
where and . There are many extrema:

![{\displaystyle x_{i}\in [-5.12,5.12]}](https://wikimedia.org/api/rest_v1/media/math/render/svg/e3560b2d6c10fff0a26c994d45374c4dc70f98e5)
- The global minimum is at where .
- The maximum function value for is located around :


![{\displaystyle x_{i}\in [\pm 4.52299366...,...,\pm 4.52299366...]}](https://wikimedia.org/api/rest_v1/media/math/render/svg/7ac5b9c951c61465b72c41405639b0ca01cf88a9)
| Number of dimensions | Maximum value at |
|---|---|
| 1 | 40.35329019 |
| 2 | 80.70658039 |
| 3 | 121.0598706 |
| 4 | 161.4131608 |
| 5 | 201.7664509 |
| 6 | 242.1197412 |
| 7 | 282.4730314 |
| 8 | 322.8263216 |
| 9 | 363.1796117 |

Here are all the values at 0.5 interval listed for the 2D Rastrigin function with :
| 0 | 20.25 | 1 | 22.25 | 4 | 26.25 | 9 | 32.25 | 16 | 40.25 | 25 | 28.92 | ||
| 20.25 | 40.5 | 21.25 | 42.5 | 24.25 | 46.5 | 29.25 | 52.5 | 36.25 | 60.5 | 45.25 | 49.17 | ||
| 1 | 21.25 | 2 | 23.25 | 5 | 27.25 | 10 | 33.25 | 17 | 41.25 | 26 | 29.92 | ||
| 22.25 | 42.5 | 23.25 | 44.5 | 26.25 | 48.5 | 31.25 | 54.5 | 38.25 | 62.5 | 47.25 | 51.17 | ||
| 4 | 24.25 | 5 | 26.25 | 8 | 30.25 | 13 | 36.25 | 20 | 44.25 | 29 | 32.92 | ||
| 26.25 | 46.5 | 27.25 | 48.5 | 30.25 | 52.5 | 35.25 | 58.5 | 42.25 | 66.5 | 51.25 | 55.17 | ||
| 9 | 29.25 | 10 | 31.25 | 13 | 35.25 | 18 | 41.25 | 25 | 49.25 | 34 | 37.92 | ||
| 32.25 | 52.5 | 33.25 | 54.5 | 36.25 | 58.5 | 41.25 | 64.5 | 48.25 | 72.5 | 57.25 | 61.17 | ||
| 16 | 36.25 | 17 | 38.25 | 20 | 42.25 | 25 | 48.25 | 32 | 56.25 | 41 | 44.92 | ||
| 40.25 | 60.5 | 41.25 | 62.5 | 44.25 | 66.5 | 49.25 | 72.5 | 56.25 | 80.5 | 65.25 | 69.17 | ||
| 25 | 45.25 | 26 | 47.25 | 29 | 51.25 | 34 | 57.25 | 41 | 65.25 | 50 | 53.92 | ||
| 28.92 | 49.17 | 29.92 | 51.17 | 32.92 | 55.17 | 37.92 | 61.17 | 44.92 | 69.17 | 53.92 | 57.85 | ||


The abundance of local minima underlines the necessity of a global optimization algorithm when needing to find the global minimum. Local optimization algorithms are likely to get stuck in a local minimum.
See also
Notes
- ^ Rastrigin, L. A. "Systems of extremal control." Mir, Moscow (1974).
- ^ G. Rudolph. "Globale Optimierung mit parallelen Evolutionsstrategien". Diplomarbeit. Department of Computer Science, University of Dortmund, July 1990.
- ^ F. Hoffmeister and T. Bäck. "Genetic Algorithms and Evolution Strategies: Similarities and Differences", pages 455–469 in: H.-P. Schwefel and R. Männer (eds.): Parallel Problem Solving from Nature, PPSN I, Proceedings, Springer, 1991.
- ^ H. Mühlenbein, D. Schomisch and J. Born. "The Parallel Genetic Algorithm as Function Optimizer ". Parallel Computing, 17, pages 619–632, 1991.


