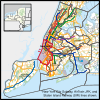
New York's 10th congressional district
U.S. House district for New York
| New York's 10th congressional district | |
|---|---|
    Interactive map of district boundaries | |
| Representative | Dan Goldman D–Manhattan |
| Area | 14.25 sq mi (36.9 km2) |
| Distribution |
|
| Population (2022) | 706,151[1] |
| Median household income | $103,988[2] |
| Ethnicity |
|
| Cook PVI | D+35[3] |
New York's 10th congressional district is a congressional district for the United States House of Representatives currently represented by Democrat Dan Goldman. The district contains all of Lower Manhattan and the western Brooklyn neighborhoods of Brooklyn Heights, DUMBO, Cobble Hill, Red Hook, Gowanus, Prospect Heights, Park Slope, and Sunset Park. The district also contains portions of Borough Park and Bay Ridge in Brooklyn, and all of Prospect Park. In Upper New York Harbor, the district includes Governors Island, Liberty Island and the Statue of Liberty, and parts of Ellis Island.
History
This congressional district has changed configurations and locations many times throughout its history due to redistricting, initially starting out as an upstate constituency before gradually moving south. Beginning in the 1870s, it shifted into parts of New York City, where it has remained to this day.
In the 20th century, the 10th district was always a Brooklyn-based seat from 1913 until 1973, when that iteration of the district was redrawn and renumbered as the new 16th, and the 10th was reassigned to a district in northern Queens and the east Bronx. The 1980 redistricting cycle restored the 10th district to Brooklyn, covering largely the same terrain as before. In the 1990 remap, much of the old 10th district was added to the new Queens–Brooklyn 9th district, while the new 10th then absorbed much of the old 11th district, including its congressman, Ed Towns.
From 2003 to 2013, this district was exclusively Brooklyn-based. During this time, it was majority-African American and included the neighborhoods of Bedford-Stuyvesant, Brooklyn Heights, Brownsville, Canarsie, East New York, and Ocean Hill, as well as parts of Fort Greene, Prospect Heights, and Williamsburg.[4] Following the 2010–12 redistricting cycle, the district shed most of its Brooklyn territory, and picked up parts of Manhattan that had been in the 8th district.
The 2010 map had a size of 14.25 sq mi (36.9 km2), New York's 10th district was the second-smallest by total area in the country, after New York's 13th.[5] Demographically, it also had the largest number (197,000 or 270,000) and the highest percentage of Jews (27.5% or 37.6%)[a] of any congressional district,[6] largely as a result of the fact that it included several heavily Jewish neighborhoods of Manhattan and Brooklyn. Prior to the 2020 census, the district stretched from the Upper West Side of Manhattan to Borough Park.
List of members representing the district
| Member | Party | Years | Cong ress | Electoral history | District location |
|---|---|---|---|---|---|
| District established March 4, 1793 | |||||
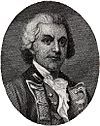 Silas Talbot (New York) | Pro-Administration | March 4, 1793 – June 5, 1794 | 3rd | Elected in 1793. Resigned to join the U.S. Navy. | 1793–1799 Western New York, approximately bounded to the east by the eastern borders of Hamilton, Fulton, Montgomery, Schoharie, and Delaware counties, and bordering (but not including) St. Lawrence County to the north |
| Vacant | June 5, 1794 – March 3, 1795 | 3rd | No special election was called by Gov. Clinton for political reasons.[citation needed] | ||
 William Cooper (Cooperstown) | Federalist | March 4, 1795 – March 3, 1797 | 4th | Elected in 1794. Lost re-election. | |
| James Cochran (Albany) | Federalist | March 4, 1797 – March 3, 1799 | 5th | Elected in 1796. Retired. | |
William Cooper (Cooperstown) | Federalist | March 4, 1799 – March 3, 1801 | 6th | Elected in 1798. Retired. | 1799–1803 All of New York west of and including Cayuga, Onondaga, Cortland, and Broome counties; also included portions of what are today Chenango and Otsego counties |
| Thomas Morris (Canadaigua) | Federalist | March 4, 1801 – March 3, 1803 | 7th | Elected in 1800. Retired. | |
 George Tibbits (Troy) | Federalist | March 4, 1803 – March 3, 1805 | 8th | Elected in 1802. Retired. | 1803–1809 Rensselaer County |
| Josiah Masters (Schaghticoke) | Democratic-Republican | March 4, 1805 – March 3, 1809 | 9th 10th | Elected in 1804. Re-elected in 1806. Retired. | |
| John Nicholson (Herkimer) | Democratic-Republican | March 4, 1809 – March 3, 1811 | 11th | Elected in 1808. Retired. | 1809–1813 Jefferson, Lewis, Herkimer, and St. Lawrence counties |
| Silas Stow (Lowville) | Democratic-Republican | March 4, 1811 – March 3, 1813 | 12th | Elected in 1810. Retired. | |
| Hosea Moffitt (Nassau) | Federalist | March 4, 1813 – March 3, 1817 | 13th 14th | Elected in 1812. Re-elected in 1814. Retired. | 1813–1823 Rensselaer County |
 John P. Cushman (Troy) | Federalist | March 4, 1817 – March 3, 1819 | 15th | Elected in 1816. Retired. | |
 John Dean Dickinson (Troy) | Federalist | March 4, 1819 – March 3, 1823 | 16th 17th | Elected in 1818. Re-elected in 1821. Redistricted to the 9th district and lost re-election. | |
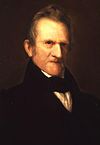
 Stephen Van Rensselaer (Albany) | Adams–Clay Federalist | March 4, 1823 – March 3, 1825 | 18th 19th 20th | Redistricted from the 9th district and re-elected in 1822. Re-elected in 1824. Re-elected in 1826. Retired. | 1823–1843 Albany County |
| Anti-Jacksonian | March 4, 1825 – March 3, 1829 | ||||
 Ambrose Spencer (Albany) | Anti-Jacksonian | March 4, 1829 – March 3, 1831 | 21st | Elected in 1828. Lost re-election. | |
 Gerrit Y. Lansing (Albany) | Jacksonian | March 4, 1831 – March 3, 1837 | 22nd 23rd 24th | Elected in 1830. Re-elected in 1832. Re-elected in 1834. Retired. | |
| Albert Gallup (East Berne) | Democratic | March 4, 1837 – March 3, 1839 | 25th | Elected in 1836. Lost re-election. | |
 Daniel D. Barnard (Albany) | Whig | March 4, 1839 – March 3, 1843 | 26th 27th | Elected in 1838. Re-elected in 1840. Redistricted to the 13th district. | |
 Jeremiah Russell (Saugerties) | Democratic | March 4, 1843 – March 3, 1845 | 28th | Elected in 1842. Lost re-election. | 1843–1853 Delaware and Ulster counties |
 Samuel Gordon (Delhi) | Democratic | March 4, 1845 – March 3, 1847 | 29th | Elected in 1844. Retired. | |
 Eliakim Sherrill (Shandaken) | Whig | March 4, 1847 – March 3, 1849 | 30th | Elected in 1846. [data missing] | |
| Herman D. Gould (Delhi) | Whig | March 4, 1849 – March 3, 1851 | 31st | Elected in 1848. Retired. | |
 Marius Schoonmaker (Kingston) | Whig | March 4, 1851 – March 3, 1853 | 32nd | Elected in 1850. Retired. | |
 William Murray (Goshen) | Independent Democratic | March 4, 1853 – March 3, 1855 | 33rd | Redistricted from the 9th district and re-elected in 1852. Retired. | 1853–1863 Sullivan and Orange counties |
 Ambrose S. Murray (Goshen) | Opposition | March 4, 1855 – March 3, 1857 | 34th 35th | Elected in 1854. Re-elected in 1856. Retired. | |
| Republican | March 4, 1857 – March 3, 1859 | ||||
 Charles Van Wyck (Bloomingburg) | Republican | March 4, 1859 – March 3, 1863 | 36th 37th | Elected in 1858. Re-elected in 1860. Retired to join the Union Army. | |
 William Radford (Yonkers) | Democratic | March 4, 1863 – March 3, 1867 | 38th 39th | Elected in 1862. Re-elected in 1864. Lost re-election. | 1863–1873 Westchester, Rockland, and Bronx counties |
 William H. Robertson (Katonah) | Republican | March 4, 1867 – March 3, 1869 | 40th | Elected in 1866. Retired. | |
 Clarkson Nott Potter (New Rochelle) | Democratic | March 4, 1869 – March 3, 1873 | 41st 42nd | Elected in 1868. Re-elected in 1870. Redistricted to the 11th district. | |
 Fernando Wood (New York) | Democratic | March 4, 1873 – March 3, 1875 | 43rd | Redistricted from the 9th district and re-elected in 1872. Redistricted back to the 9th district. | 1873–1875 Northern Manhattan |
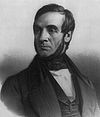
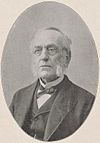
 Abram Stevens Hewitt (New York) | Democratic | March 4, 1875 – March 3, 1879 | 44th 45th | Elected in 1874. Re-elected in 1876. Retired. | 1875–1913 Various parts of Midtown and Lower Manhattan |
 James O'Brien (New York) | Independent Democratic | March 4, 1879 – March 3, 1881 | 46th | Elected in 1878. Lost renomination. | |
Abram Stevens Hewitt (New York) | Democratic | March 4, 1881 – December 30, 1886 | 47th 48th 49th | Elected in 1880. Re-elected in 1882. Re-elected in 1884. Resigned to become Mayor of New York City. | |
| Vacant | December 30, 1886 – March 3, 1887 | 49th | |||
 Francis B. Spinola (New York) | Democratic | March 4, 1887 – April 14, 1891 | 50th 51st 52nd | Elected in 1886. Re-elected in 1888. Re-elected in 1890. Died. | |
| Vacant | April 14, 1891 – November 3, 1891 | 52nd | |||
 William Bourke Cockran (New York) | Democratic | November 3, 1891 – March 3, 1893 | 52nd | Elected to finish Spinola's term. Redistricted to the 12th district. | |
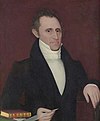
 Daniel Sickles (New York) | Democratic | March 4, 1893 – March 3, 1895 | 53rd | Elected in 1892. Lost re-election. | |
| Vacant | March 4, 1895 – November 5, 1895 | 54th | Representative-elect Andrew J. Campbell died before term began. | ||
 Amos J. Cummings (New York) | Democratic | November 5, 1895 – May 2, 1902 | 54th 55th 56th 57th | Elected to finish Campbell's term. Re-elected in 1896. Re-elected in 1898. Re-elected in 1900. Died. | |
| Vacant | May 2, 1902 – November 4, 1902 | 57th | |||
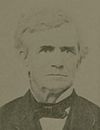
 Edward Swann (New York) | Democratic | November 4, 1902 – March 3, 1903 | 57th | Elected to finish Cummings's term. Retired. | |
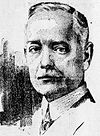
 William Sulzer (New York) | Democratic | March 4, 1903 – December 31, 1912 | 58th 59th 60th 61st 62nd | Redistricted from the 11th district and re-elected in 1902. Re-elected in 1904. Re-elected in 1906. Re-elected in 1908. Re-elected in 1910. Resigned to become Governor of New York. | |
| Vacant | January 1, 1913 – March 3, 1913 | 62nd | |||
 Herman A. Metz (Brooklyn) | Democratic | March 4, 1913 – March 3, 1915 | 63rd | Elected in 1912. Retired. | 1913–1963 Various parts of Brooklyn |
 Reuben L. Haskell (Brooklyn) | Republican | March 4, 1915 – December 31, 1919 | 64th 65th 66th | Elected in 1914. Re-elected in 1916. Re-elected in 1918. Resigned. | |
| Vacant | December 31, 1919 – November 2, 1920 | 66th | |||
 Lester D. Volk (Brooklyn) | Republican | November 2, 1920 – March 3, 1923 | 66th 67th | Elected to finish Haskell's term. Re-elected in 1920. Lost re-election. | |
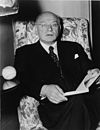 Emanuel Celler (Brooklyn) | Democratic | March 4, 1923 – January 3, 1945 | 68th 69th 70th 71st 72nd 73rd 74th 75th 76th 77th 78th | Elected in 1922. Re-elected in 1924. Re-elected in 1926. Re-elected in 1928. Re-elected in 1930. Re-elected in 1932. Re-elected in 1934. Re-elected in 1936. Re-elected in 1938. Re-elected in 1940. Re-elected in 1942. Redistricted to the 15th district. | |
 Andrew L. Somers (Brooklyn) | Democratic | January 3, 1945 – April 6, 1949 | 79th 80th 81st | Redistricted from the 6th district and re-elected in 1944. Re-elected in 1946. Re-elected in 1948. Died. | |
| Vacant | April 7, 1949 – November 7, 1949 | 81st | |||
 Edna F. Kelly (Brooklyn) | Democratic | November 8, 1949 – January 3, 1963 | 81st 82nd 83rd 84th 85th 86th 87th | Elected to finish Somers's term Re-elected in 1950. Re-elected in 1952. Re-elected in 1954. Re-elected in 1956. Re-elected in 1958. Re-elected in 1960. Redistricted to the 12th district. | |
Emanuel Celler (Brooklyn) | Democratic | January 3, 1963 – January 3, 1971 | 88th 89th 90th 91st 92nd | Redistricted from the 11th district and re-elected in 1962. Re-elected in 1964. Re-elected in 1966. Re-elected in 1968. Re-elected in 1970. Redistricted to the 16th district and lost renomination. | 1963–1971 Parts of Brooklyn and Queens |
| January 3, 1971 – January 3, 1973 | 1971–1973 Parts of Brooklyn | ||||
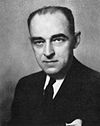
 Mario Biaggi (The Bronx) | Democratic | January 3, 1973 – January 3, 1983 | 93rd 94th 95th 96th 97th | Redistricted from the 24th district and re-elected in 1972. Re-elected in 1974. Re-elected in 1976. Re-elected in 1978. Re-elected in 1980. Redistricted to the 19th district. | 1973–1983 Parts of Queens and the Bronx |
 Chuck Schumer (Brooklyn) | Democratic | January 3, 1983 – January 3, 1993 | 98th 99th 100th 101st 102nd | Redistricted from the 16th district and re-elected in 1982. Re-elected in 1984. Re-elected in 1986. Re-elected in 1988. Re-elected in 1990. Redistricted to the 9th district. | 1983–2003 Parts of Brooklyn |
 Ed Towns (Brooklyn) | Democratic | January 3, 1993 – January 3, 2013 | 103rd 104th 105th 106th 107th 108th 109th 110th 111th 112th | Redistricted from the 11th district and re-elected in 1992. Re-elected in 1994. Re-elected in 1996. Re-elected in 1998. Re-elected in 2000. Re-elected in 2002. Re-elected in 2004. Re-elected in 2006. Re-elected in 2008. Re-elected in 2010. Retired. | |
| 2003–2013 Parts of Brooklyn  | |||||
 Jerry Nadler (New York) | Democratic | January 3, 2013 – January 3, 2023 | 113th 114th 115th 116th 117th | Redistricted from the 8th district and re-elected in 2012. Re-elected in 2014. Re-elected in 2016. Re-elected in 2018. Re-elected in 2020. Redistricted to the 12th district. | 2013–2023 Parts of Manhattan and Brooklyn  |
 Dan Goldman (New York) | Democratic | January 3, 2023 – present | 118th | Elected in 2022. | 2023–2025 Parts of Manhattan and Brooklyn 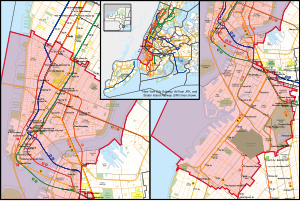 |
National and statewide election results
| Year | Office | Results |
|---|---|---|
| 1992 | President | B. Clinton 83–13% |
| 1996 | President | B. Clinton 90–6% |
| 2000 | President | Gore 88–8% |
| 2004 | President | Kerry 86–13% |
| 2008 | President | Obama 76–23% |
| 2012 | President | Obama 73–25% |
| 2016 | President | H. Clinton 78–18% |
| 2020 | President | Biden 76–22% |
Electoral history
District election results
The following are historical results for the 10th district's congressional elections.[b]
| Party | Candidate | Votes | % | ±% | |
|---|---|---|---|---|---|
| Democratic | Clarkson Nott Potter (incumbent) | 14,249 | 57.1 | ||
| Republican | James Westervelt | 10,685 | 42.9 | ||
| Majority | 3,564 | 14.2 | |||
| Turnout | 24,934 | 100 | |||
| Party | Candidate | Votes | % | ±% | |
|---|---|---|---|---|---|
| Democratic | Edolphus Towns (incumbent) | 99,889 | 91.3 | ||
| Republican | Amelia Smith-Parker | 8,660 | 7.9 | ||
| Right to Life | Julian M. Hill, Jr. | 893 | 0.8 | ||
| Majority | 91,229 | 83.4 | |||
| Turnout | 109,442 | 100 | |||
| Party | Candidate | Votes | % | ±% | |
|---|---|---|---|---|---|
| Democratic | Edolphus Towns (incumbent) | 83,528 | 92.3 |  1.0 1.0 | |
| Republican | Ernestine M. Brown | 5,577 | 6.2 |  1.7 1.7 | |
| Conservative | Ernest Johnson | 1,396 | 1.5 | 1.5 | |
| Majority | 77,951 | 86.1 | 2.7 | ||
| Turnout | 90,501 | 100 | 17.3 | ||
| Party | Candidate | Votes | % | ±% | |
|---|---|---|---|---|---|
| Democratic | Edolphus Towns (incumbent) | 120,700 | 90.2 | 2.1 | |
| Republican | Ernestine M. Brown | 6,852 | 5.1 | 1.1 | |
| Working Families | Barry Ford | 5,530 | 4.1 | 4.1 | |
| Conservative | Ernest Johnson | 802 | 0.6 | 0.9 | |
| Majority | 113,848 | 85.0 | 1.1 | ||
| Turnout | 133,884 | 100 | 47.9 | ||
| Party | Candidate | Votes | % | ±% | |
|---|---|---|---|---|---|
| Democratic | Edolphus Towns (incumbent) | 73,859 | 97.8 | 7.6 | |
| Conservative | Herbert F. Rayn | 1,639 | 2.2 | 1.6 | |
| Majority | 72,220 | 95.7 | 10.7 | ||
| Turnout | 75,498 | 100 | 43.6 | ||
| Party | Candidate | Votes | % | ±% | |
|---|---|---|---|---|---|
| Democratic | Edolphus Towns (incumbent) | 136,113 | 91.5 | 6.3 | |
| Republican | Harvey R. Clarke | 11,099 | 7.5 | 7.5 | |
| Conservative | Mariana Blume | 1,554 | 1.0 | 1.2 | |
| Majority | 125,014 | 84.0 | 11.7 | ||
| Turnout | 148,766 | 100 | 97.0 | ||
| Party | Candidate | Votes | % | ±% | |
|---|---|---|---|---|---|
| Democratic | Edolphus Towns (incumbent) | 72,171 | 92.2 | 0.7 | |
| Republican | Jonathan H. Anderson | 4,666 | 6.0 | 1.5 | |
| Conservative | Ernest Johnson | 1,470 | 1.9 | 0.9 | |
| Majority | 67,505 | 86.2 | 2.2 | ||
| Turnout | 78,307 | 100 | 47.4 | ||
| Party | Candidate | Votes | % | ±% | |
|---|---|---|---|---|---|
| Democratic | Jerry Nadler (incumbent) | 89,080 | 87.6 | n/a | |
| Conservative | Ross Brady | 12,042 | 11.8 | n/a | |
| Flourish Every Person | Michael Dilger | 554 | 0.6 | n/a | |
| Majority | 89,080 | 75.8 | n/a | ||
| Turnout | 113,226 | 20.1 | n/a | ||
| Party | Candidate | Votes | % | ±% | |
|---|---|---|---|---|---|
| Democratic | Jerry Nadler (incumbent) | 25,527 | 89.6 | n/a | |
| Democratic | Oliver Rosenberg | 2,949 | 10.4 | n/a | |
| Majority | 22,578 | 79.3 | n/a | ||
| Turnout | 28,476 | 5.1 | n/a | ||
| Party | Candidate | Votes | % | ±% | |
|---|---|---|---|---|---|
| Democratic | Jerry Nadler (incumbent) | 170,286 | 77.5 | n/a | |
| Republican | Philip Rosenthal | 49,530 | 22.5 | n/a | |
| Majority | 120,756 | 55 | n/a | ||
| Turnout | 219,816 | 39.4 | n/a | ||
| Party | Candidate | Votes | % | ±% | |
|---|---|---|---|---|---|
| Democratic | Jerry Nadler (incumbent) | 173,095 | 82.1 | n/a | |
| Republican | Naomi Levin | 33,692 | 16.0 | n/a | |
| Majority | 173,095 | 82 | n/a | ||
| Turnout | 210,714 | 100 | n/a | ||
| Party | Candidate | Votes | % | ±% | |
|---|---|---|---|---|---|
| Democratic | Jerry Nadler (incumbent) | 51,054 | 64.2 | n/a | |
| Democratic | Lindsey Boylan | 16,511 | 20.8 | n/a | |
| Democratic | Jonathan Herzog | 7,829 | 9.9 | n/a | |
| Majority | 34,543 | 43.4 | n/a | ||
| Turnout | 79,483 | 30.0 | n/a | ||
| Party | Candidate | Votes | % | |
|---|---|---|---|---|
| Democratic | Jerry Nadler | 181,215 | 65.5 | |
| Working Families | Jerry Nadler | 25,095 | 9.1 | |
| Total | Jerry Nadler (incumbent) | 206,310 | 74.6 | |
| Republican | Cathy Bernstein | 61,045 | 22.1 | |
| Conservative | Cathy Bernstein | 5,844 | 2.1 | |
| Total | Cathy Bernstein | 66,889 | 24.2 | |
| Libertarian | Michael Madrid | 3,370 | 1.2 | |
| Total votes | 276,569 | 100.0 | ||
| Democratic hold | ||||
| Party | Candidate | Votes | % | |
|---|---|---|---|---|
| Democratic | Dan Goldman | 16,686 | 25.8 | |
| Democratic | Yuh-Line Niou | 15,380 | 23.7 | |
| Democratic | Mondaire Jones (incumbent)[c] | 11,777 | 18.2 | |
| Democratic | Carlina Rivera | 10,985 | 17.0 | |
| Democratic | Jo Anne Simon | 3,991 | 6.2 | |
| Democratic | Elizabeth Holtzman | 2,845 | 4.4 | |
| Democratic | Jimmy Li | 777 | 1.2 | |
| Democratic | Yan Xiong | 686 | 1.1 | |
| Democratic | Maud Maron | 578 | 0.9 | |
| Democratic | Bill de Blasio (withdrawn) | 477 | 0.7 | |
| Democratic | Brian Robinson | 322 | 0.5 | |
| Democratic | Peter Gleason | 147 | 0.2 | |
| Democratic | Quanda Francis | 121 | 0.2 | |
| Total votes | 64,772 | 100.0 | ||
| Party | Candidate | Votes | % | |
|---|---|---|---|---|
| Democratic | Daniel Goldman | 160,582 | 83.49% | |
| Republican | Benine Hamdan | 26,711 | 13.89% | |
| Conservative | Benine Hamdan | 2,347 | 1.22% | |
| Total | Benine Hamdan | 29,058 | 15.11% | |
| Medical Freedom Party | Steve Speer | 1,447 | 0.75% | |
| Write-in | 1,260 | 0.66% | ||
| Total votes | 192,347 | 100% | ||
See also
 United States portal
 New York City portal
 New York (state) portal
 Politics portal


- List of United States congressional districts
- New York's congressional districts
- United States congressional delegations from New York
Notes
- ^ The cited reference appears to contradict itself on the Jewish population of the 10th District. The maps in the report use a population of 197,000.
- ^ In New York State, there are numerous minor parties at various points on the political spectrum. Certain parties will invariably endorse either the Republican or Democratic candidate for an office; hence, where applicable, the state electoral results below contain both the individual party votes and the final candidate votes (listed as "Total").
- ^ Due to redistricting, Mondaire Jones decided to move to NY-10, which is not connected by territory to his home district of NY-17.
References
- ^ "New York congressional districts by urban and rural population and land area". United States Census Bureau. June 8, 2017. Archived from the original on November 21, 2019. Retrieved November 21, 2019.
- ^ "My Congressional District". US Census Bureau. Retrieved October 5, 2023.
- ^ "2022 Cook PVI: District Map and List". Cook Political Report. July 12, 2022. Retrieved January 10, 2023.
- ^ "The Art of the Gerrymander - 11 of 11". POLITICO Magazine. Retrieved June 28, 2019.
- ^ "New York congressional districts by urban and rural population and land area". United States Census Bureau. Retrieved December 11, 2014.
- ^ "2014 Jewish Maps of the United States by Congressional District (Comenetz)".
- ^ County of New York (1871). November Election, 1870. Complete Statement of the Official Canvass, in Detail of the Election Held November 8, 1870, Giving the Vote of Each Election District, with Proceedings of County And State... Vol. II. p. 2031. Retrieved March 13, 2009.
- ^ "New York House Races Results". Politico. Retrieved July 13, 2016.
- ^ a b c "New York U.S. House 10th District Results: Jerrold Nadler Wins - Election Results 2016". The New York Times. Retrieved February 24, 2017.
- ^ "Statement and Return Report for Certification: Primary Election 2020 - 06/23/2020: Crossover - Democratic Party: Democratic Representative in Congress: 10th Congressional District" (PDF). Retrieved July 13, 2016.
- Martis, Kenneth C. (1989). The Historical Atlas of Political Parties in the United States Congress. New York: Macmillan Publishing Company.
- Martis, Kenneth C. (1982). The Historical Atlas of United States Congressional Districts. New York: Macmillan Publishing Company.
- Congressional Biographical Directory of the United States 1774–present
- 2006 House election data Clerk of the House of Representatives
- 2004 House election data
- 2002 House election data
- 2000 House election data
- 1998 House election data
- 1996 House election data
- v
- t
- e
- The at-large and 27th–45th districts are obsolete.
- See also
- New York's past and present representatives, senators, and delegations
| Authority control databases |
|
|---|
40°42′07″N 74°00′26″W / 40.70194°N 74.00722°W / 40.70194; -74.00722


