U.S. House district for Florida
- 51.34% urban[2]
- 48.66% rural
| Population (2022) | 792,422[3] |
|---|
Median household
income | $57,516[4] |
|---|
| Ethnicity | - 63.3% White
- 22.5% Black
- 7.1% Hispanic
- 4.2% Two or more races
- 2.1% Asian
- 0.8% other
|
|---|
| Cook PVI | R+8[5] |
|---|
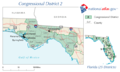
Florida's 2nd congressional district is a congressional district in the U.S. state of Florida. The district consists of the eastern part of the Florida Panhandle along with much of the Big Bend region along the Emerald Coast. It straddles both the Eastern and Central time zones. It includes Tallahassee, the state capital, and Panama City. With 49% of its residents living in rural areas, it is the least urbanized district in the state, and voters are generally conservative. The district is represented by Republican Neal Dunn of Panama City.
Characteristics
Florida's 2nd Congressional District is the largest congressional district in Florida by land area and consists of all of Bay, Calhoun, Franklin, Gadsden, Gulf, Holmes, Jackson, Jefferson, Leon, Liberty, Madison, Taylor, Wakulla, and Washington counties, as well as portions of Walton and Lafayette.
Most of the territory now in the 2nd was the 9th District from 1963 to 1983; it has been the 2nd since 1983. For most of its existence, the 2nd and its predecessors were centered in Tallahassee, the state capital and county seat of Leon County. While the adjacent 1st and 3rd congressional districts had become the most conservative districts in the state by the 1990s, the 2nd District was historically more of a swing district. With a large population of students, government workers and university faculty, Tallahassee was far more liberal than the rest of the district. Democrat Barack Obama received 62 percent of the Leon County vote in the 2008 presidential election, but Republican John McCain received 54 percent of the 2nd district's vote overall.[6] The district had become somewhat friendlier to Republicans when conservative-leaning Panama City was shifted from the 1st District.
The district was significantly redrawn in a court-ordered redistricting that took effect for the 2016 election, following a lawsuit that challenged the district as gerrymandered, preventing African Americans from being able to elect representatives of their choice although they comprised a significant part of the population in the state. Under the new map, most of Tallahassee, along with nearly all of the 2nd's black residents, were drawn into the 5th District.
To make up for the loss in population, the 2nd was shifted slightly to the south to take in territory previously in the nearby 3rd and 11th districts. On paper, the new 2nd was more than 12 points more Republican than its predecessor. Mitt Romney had carried the old 2nd in 2012 although he received only 52 percent of the vote.[7] By comparison, Romney would have carried the new 2nd with 64 percent of the vote in 2012, making it on paper the third-most Republican district in the state.[8]
Voting
Voter registration
| Voter Registration and Party Enrollment as of February 20, 2024[9] |
| Party | Voters | Percentage |
| | Republican | 218,080 | 42.98% |
| | Democratic | 187,805 | 37.01% |
| | No Party Affiliation | 84,548 | 17.90% |
Composition
| # | County | Seat | Population |
| 5 | Bay | Panama City | 190,769 |
| 13 | Calhoun | Blountstown | 13,470 |
| 37 | Franklin | Apalachicola | 12,594 |
| 39 | Gadsden | Quincy | 43,833 |
| 45 | Gulf | Port St. Joe | 15,693 |
| 59 | Holmes | Bonifay | 19,944 |
| 63 | Jackson | Marianna | 48,622 |
| 65 | Jefferson | Monticello | 15,450 |
| 73 | Leon | Tallahassee | 296,913 |
| 77 | Liberty | Bristol | 7,706 |
| 79 | Madison | Madison | 18,519 |
| 123 | Taylor | Perry | 21,682 |
| 129 | Wakulla | Crawfordville | 36,449 |
| 131 | Walton | DeFuniak Springs | 86,354 |
| 133 | Washington | Chipley | 25,602 |
Cities with 10,000 or more people
2,500-10,000 people
- Springfield – 8,075
- Quincy – 7,970
- Perry – 7,059
- Marianna – 6,245
- DeFuniak Springs – 5,919
- Crawfordville – 4,853
- Lower Grand Lagoon – 4,398
- Laguna Beach – 4,330
- Woodville – 4,097
- Chipley – 3,660
- Midway – 3,537
- Port St. Joe – 3,357
- Cedar Grove – 3,148
- Chattahoochee – 2,955
- Madison – 2,912
- Pretty Bayou – 2,911
- Bonifay – 2,759
- Eastpoint – 2,614
- Carrabelle – 2,606
- Monticello – 2,589
List of members representing the district
| Representative | Party | Years | Cong
ress | Electoral history |
| District created March 4, 1875 |
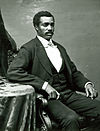
Josiah T. Walls
(Gainesville) | Republican | March 4, 1875 –
April 19, 1876 | 44th | Redistricted from the at-large district.
Lost contested election |

Jesse J. Finley
(Jacksonville) | Democratic | April 19, 1876 –
March 3, 1877 | 44th | Won contested election.
[data missing] |
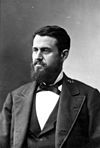
Horatio Bisbee Jr.
(Jacksonville) | Republican | March 4, 1877 –
February 20, 1879 | 45th | Lost contested election. |
Jesse J. Finley
(Jacksonville) | Democratic | February 20, 1879 –
March 3, 1879 | 45th | Won contested election.
[data missing] |

Noble A. Hull
(Sanford) | Democratic | March 4, 1879 –
January 22, 1881 | 46th | Lost contested election |
Horatio Bisbee Jr.
(Jacksonville) | Republican | January 22, 1881 –
March 3, 1881 | 46th | Won contested election.
[data missing] |
Jesse J. Finley
(Jacksonville) | Democratic | March 4, 1881 –
June 1, 1882 | 47th | Lost contested election |
Horatio Bisbee Jr.
(Jacksonville) | Republican | June 1, 1882 –
March 3, 1885 | 47th
48th | Won contested election.
Re-elected in 1882.
[data missing] |

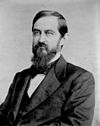
Charles Dougherty
(Port Orange) | Democratic | March 4, 1885 –
March 3, 1889 | 49th
50th | Elected in 1884.
Re-elected in 1886.
[data missing] |

Robert Bullock
(Ocala) | Democratic | March 4, 1889 –
March 3, 1893 | 51st
52nd | Elected in 1888.
Re-elected in 1890.
[data missing] |
Charles M. Cooper
(Jacksonville) | Democratic | March 4, 1893 –
March 3, 1897 | 53rd
54th | Elected in 1892.
Re-elected in 1894.
[data missing] |

Robert W. Davis
(Palatka) | Democratic | March 4, 1897 –
March 3, 1905 | 55th
56th
57th
58th | Elected in 1896.
Re-elected in 1898.
Re-elected in 1900.
Re-elected in 1902.
[data missing] |

Frank Clark
(Gainesville) | Democratic | March 4, 1905 –
March 3, 1925 | 59th
60th
61st
62nd
63rd
64th
65th
66th
67th
68th |
Elected in 1904.
Re-elected in 1906.
Re-elected in 1908.
Re-elected in 1910.
Re-elected in 1912.
Re-elected in 1914.
Re-elected in 1916.
Re-elected in 1918.
Re-elected in 1920.
Re-elected in 1922.
[data missing] |
Robert A. Green
(Starke) | Democratic | March 4, 1925 –
January 3, 1943 | 69th
70th
71st
72nd
73rd
74th
75th
76th
77th | Elected in 1924.
Re-elected in 1926.
Re-elected in 1928.
Re-elected in 1930.
Re-elected in 1932.
Re-elected in 1934.
Re-elected in 1936.
Re-elected in 1938.
Re-elected in 1940.
Redistricted to the at-large district. |
Emory H. Price
(Jacksonville) | Democratic | January 3, 1943 –
January 3, 1949 | 78th
79th
80th | Elected in 1942.
Re-elected in 1944.
Re-elected in 1946.
[data missing] |
Charles E. Bennett
(Jacksonville) | Democratic | January 3, 1949 –
January 3, 1967 | 81st
82nd
83rd
84th
85th
86th
87th
88th
89th | Elected in 1948.
Re-elected in 1950.
Re-elected in 1952.
Re-elected in 1954.
Re-elected in 1956.
Re-elected in 1958.
Re-elected in 1960.
Re-elected in 1962.
Re-elected in 1964.
Redistricted to the 3rd district. |
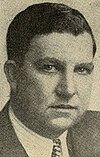
Don Fuqua
(Altha) | Democratic | January 3, 1967 –
January 3, 1987 | 90th
91st
92nd
93rd
94th
95th
96th
97th
98th
99th | Redistricted from the 9th district and re-elected in 1966.
Re-elected in 1968.
Re-elected in 1970.
Re-elected in 1972.
Re-elected in 1974.
Re-elected in 1976.
Re-elected in 1978.
Re-elected in 1980.
Re-elected in 1982.
Re-elected in 1984.
[data missing] |
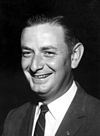
James W. Grant
(Madison) | Democratic | January 3, 1987 –
February 21, 1989 | 100th
101st | Elected in 1986.
Re-elected in 1988.
Lost re-election. |
| Republican | February 21, 1989 –
January 3, 1991 | 101st |

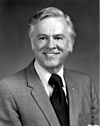
Pete Peterson
(Marianna) | Democratic | January 3, 1991 –
January 3, 1997 | 102nd
103rd
104th | Elected in 1990.
Re-elected in 1992.
Re-elected in 1994.
Retired. |
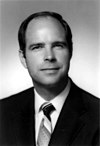
Allen Boyd
(Monticello) | Democratic | January 3, 1997 –
January 3, 2011 | 105th
106th
107th
108th
109th
110th
111th | Elected in 1996.
Re-elected in 1998.
Re-elected in 2000.
Re-elected in 2002.
Re-elected in 2004.
Re-elected in 2006.
Re-elected in 2008.
Lost re-election. |

Steve Southerland
(Panama City) | Republican | January 3, 2011 –
January 3, 2015 | 112th
113th | Elected in 2010.
Re-elected in 2012.
Lost re-election. |
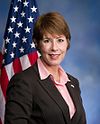
Gwen Graham
(Tallahassee) | Democratic | January 3, 2015 –
January 3, 2017 | 114th | Elected in 2014.
Retired due to redistricting. |

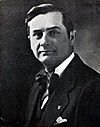
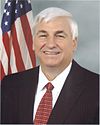
Neal Dunn
(Panama City) | Republican | January 3, 2017 –
present | 115th
116th
117th
118th | Elected in 2016.
Re-elected in 2018.
Re-elected in 2020.
Re-elected in 2022. |
Election results
2002
Florida's 2nd Congressional District Election (2002) | Party | Candidate | Votes | % |
| | Democratic | Allen Boyd* | 152,164 | 67% |
| | Republican | Tom McGurk | 75,275 | 33% |
| Total votes | 227,439 | 100% |
| Turnout | | |
| | Democratic hold |
2004
Florida's 2nd Congressional District Election (2004) | Party | Candidate | Votes | % |
| | Democratic | Allen Boyd* | 201,577 | 62% |
| | Republican | Bev Kilmer | 125,399 | 38% |
| Total votes | 326,976 | 100% |
| Turnout | | |
| | Democratic hold |
2006
Florida's 2nd Congressional District Election (2006) | Party | Candidate | Votes | % |
| | Democratic | Allen Boyd* | | 100% |
| Total votes | | 100% |
| Turnout | | |
| | Democratic hold |
2008
Florida's 2nd Congressional District Election (2008) | Party | Candidate | Votes | % |
| | Democratic | Allen Boyd* | 216,804 | 62% |
| | Republican | Mark Mulligan | 133,404 | 38% |
| | No party | Others | 159 | 0.05 |
| Total votes | 350,367 | 100% |
| Turnout | | |
| | Democratic hold |
2010
Florida's 2nd Congressional District Election (2010) | Party | Candidate | Votes | % |
| | Republican | Steve Southerland | 136,371 | 54% |
| | Democratic | Allen Boyd* | 105,211 | 41% |
| | Independent | Paul Crandall McKain | 7,135 | 3% |
| | Independent | Dianne J. Berryhill | 5,705 | 2% |
| | No party | Others | 16 | 0 |
| Total votes | 254,438 | 100% |
| Turnout | | |
| | Republican gain from Democratic |
2012
Florida's 2nd Congressional District Election (2012) | Party | Candidate | Votes | % |
| | Republican | Steve Southerland* | 175,856 | 53% |
| | Democratic | Alfred Lawson, Jr. | 157,634 | 47% |
| | No party | Floyd Patrick Miller | 228 | 0.01 |
| Total votes | 333,718 | 100% |
| Turnout | | |
| | Republican hold |
2014
Florida's 2nd Congressional District Election, (2014)[10] | Party | Candidate | Votes | % |
| | Democratic | Gwen Graham | 126,096 | 50.5% |
| | Republican | Steve Southerland* | 123,262 | 49.3% |
| | Write-in | Luther Lee | 422 | 0.2% |
| Total votes | 249,780 | 100% |
| | Democratic gain from Republican |
2016
Florida's 2nd Congressional District Election (2016) | Party | Candidate | Votes | % |
| | Republican | Neal Dunn | 231,163 | 67% |
| | Democratic | Walter Dartland | 102,801 | 30% |
| | Libertarian | Rob Lapham | 9,395 | 3% |
| | No party | Others | 3 | 0 |
| Total votes | 343,362 | 100% |
| Turnout | | |
| | Republican gain from Democratic |
2018
Florida's 2nd Congressional District Election (2018)[11] | Party | Candidate | Votes | % |
| | Republican | Neal Dunn (Incumbent) | 199,335 | 67.4% |
| | Democratic | Bob Rackleff | 96,233 | 32.6% |
| Total votes | 295,568 | 100% |
| Turnout | | |
| | Republican hold |
2020
2022
Historical district boundaries
References
- Martis, Kenneth C. (1989). The Historical Atlas of Political Parties in the United States Congress. New York: Macmillan Publishing Company.
- Martis, Kenneth C. (1982). The Historical Atlas of United States Congressional Districts. New York: Macmillan Publishing Company.
- Congressional Biographical Directory of the United States 1774–present
Notes
- ^ "Congressional Plan--SC14-1905 (Ordered by The Florida Supreme Court, 2-December-2015)" (PDF). Florida Senate Committee on Reapportionment. Retrieved January 11, 2017.
- ^ "Congressional Districts Relationship Files (state-based)". www.census.gov. US Census Bureau Geography.
- ^ "My Congressional District". www.census.gov. Center for New Media & Promotion (CNMP), US Census Bureau.
- ^ "My Congressional District".
- ^ "2022 Cook PVI: District Map and List". Cook Political Report. July 12, 2022. Retrieved January 10, 2023.
- ^ "2008 Florida: Presidential County Results". The New York Times.
- ^ "Daily Kos Elections 2008 & 2012 presidential election results for congressional districts used in 2012 & 2014 elections". google.com.
- ^ "Florida election results by 2016 congressional districts". google.com.
- ^ "Bookclosing Reports - Regular - Division of Elections - Florida Department of State". dos.myflorida.com. Retrieved May 1, 2024.
- ^ "November 4, 2014 General Election Official Results". Florida Department of State Division of Elections. Archived from the original on January 24, 2015. Retrieved January 1, 2015.
- ^ "Florida's 2nd Congressional District election, 2018".
30°16′58″N 84°43′49″W / 30.28278°N 84.73028°W / 30.28278; -84.73028


 2003–2013
 2013–2017
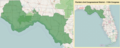 2017–2023


